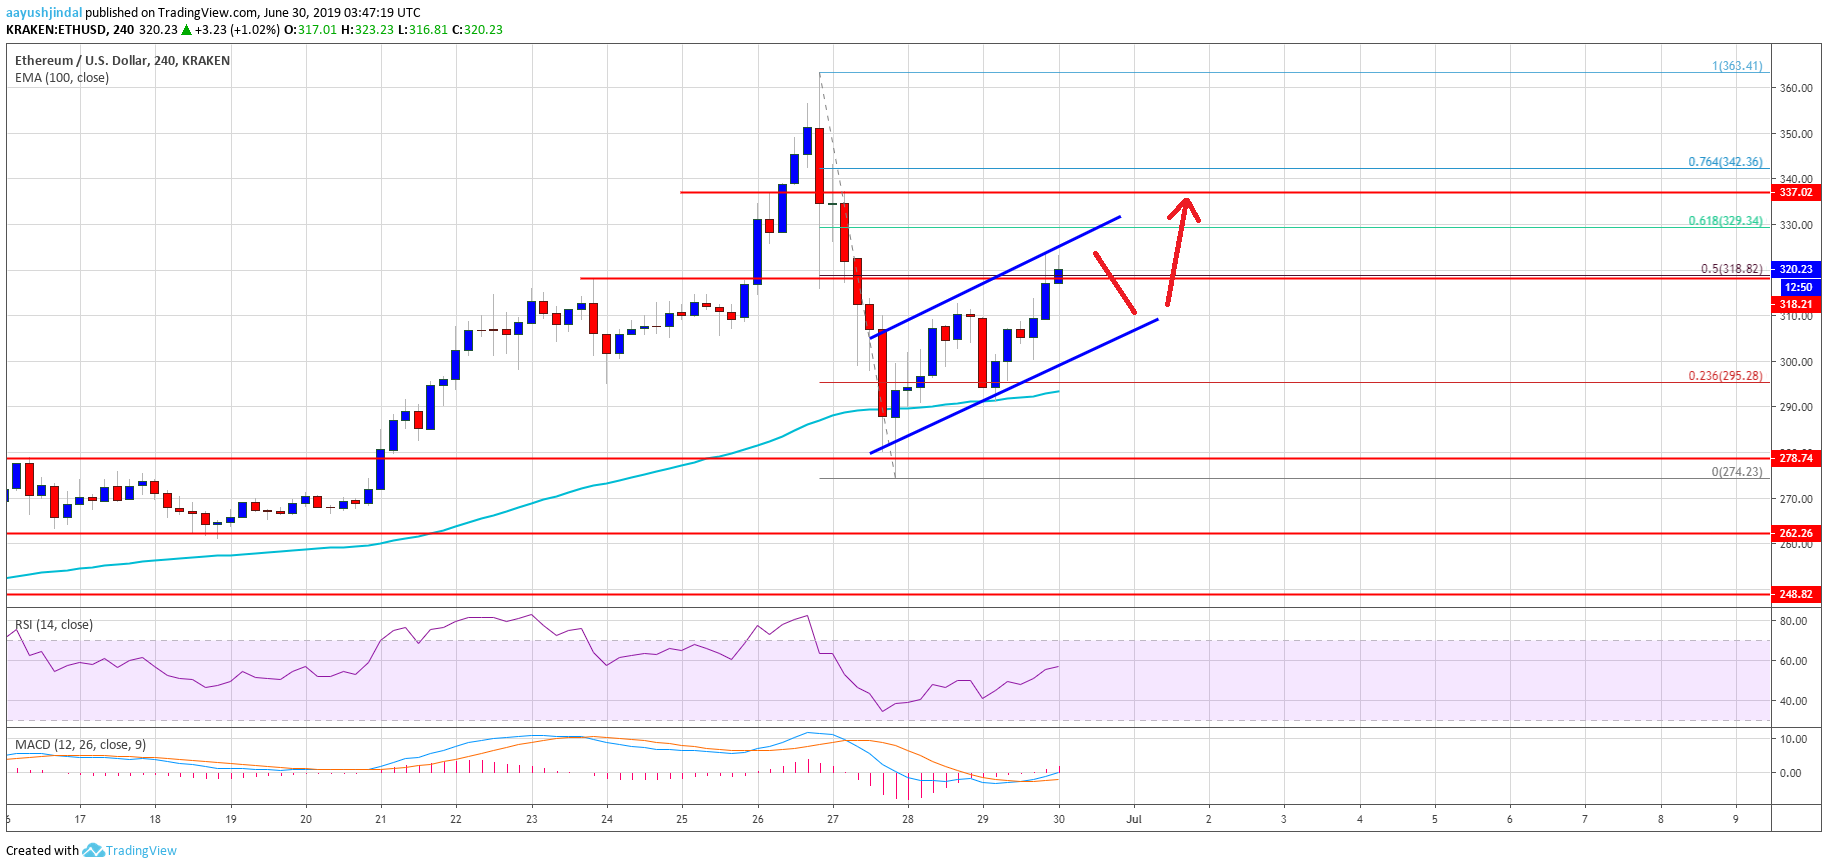
- ETH price completed a downside correction near the key $275 support area against the US Dollar.
- Bitcoin price is back above the $12,000 level and is signaling a strong bullish momentum.
- There is a key ascending channel in place with support near $310 on the 4-hours chart of ETH/USD (data feed via Kraken).
- The pair is likely to continue higher and it could even surpass the main $340 resistance area.
Ethereum price is slowly moving back in a positive zone against the US Dollar, similar to bitcoin. ETH is likely to accelerate once it clears the $330 and $340 resistance levels.
Ethereum Price Weekly Analysis
This past week, Ethereum price started a major downside correction from the $363 high against the US Dollar. The ETH/USD pair traded below a couple of important supports near the $340 and $320 levels. The price even declined below the $300 support and tested the main $275 support area. A swing low was formed near $274 and the price recently started a fresh increase. It is now trading above the $300 level and the 100 simple moving average (4-hours).
Moreover, there was a break above the 23.6% Fib retracement level of the recent drop from the $363 high to $274 low. The current price action is positive and the price is now trading nicely above $310. Additionally, there is a key ascending channel in place with support near $310 on the 4-hours chart of ETH/USD. At the moment, the price is just above the 50% Fib retracement level of the recent drop from the $363 high to $274 low.
If there is an upside break above the $330 resistance, the price could accelerate higher. The next important resistance is near the 340 level. Moreover, the 76.4% Fib retracement level of the recent drop from the $363 high to $274 low is also near $342. Once there is a break above $340 and $342, the price could accelerate towards the $363 high or even $375.
On the downside, there is a strong support forming near the $310 level. If there is a downside break below the channel support, the price might decline towards the $300 support.
The above chart indicates that Ethereum price likely completed a downside correction and is currently moving higher. If there is a successful break above $330 and $340, there could be strong gains in the coming sessions.
Technical Indicators
4 hours MACD – The MACD for ETH/USD is slowly moving back in the bullish zone.
4 hours RSI – The RSI for ETH/USD is currently well above the 750 level, with a positive momentum and angle.
Major Support Level – $310
Major Resistance Level – $340


