Reason to trust
How Our News is Made
Strict editorial policy that focuses on accuracy, relevance, and impartiality
Ad discliamer
Morbi pretium leo et nisl aliquam mollis. Quisque arcu lorem, ultricies quis pellentesque nec, ullamcorper eu odio.
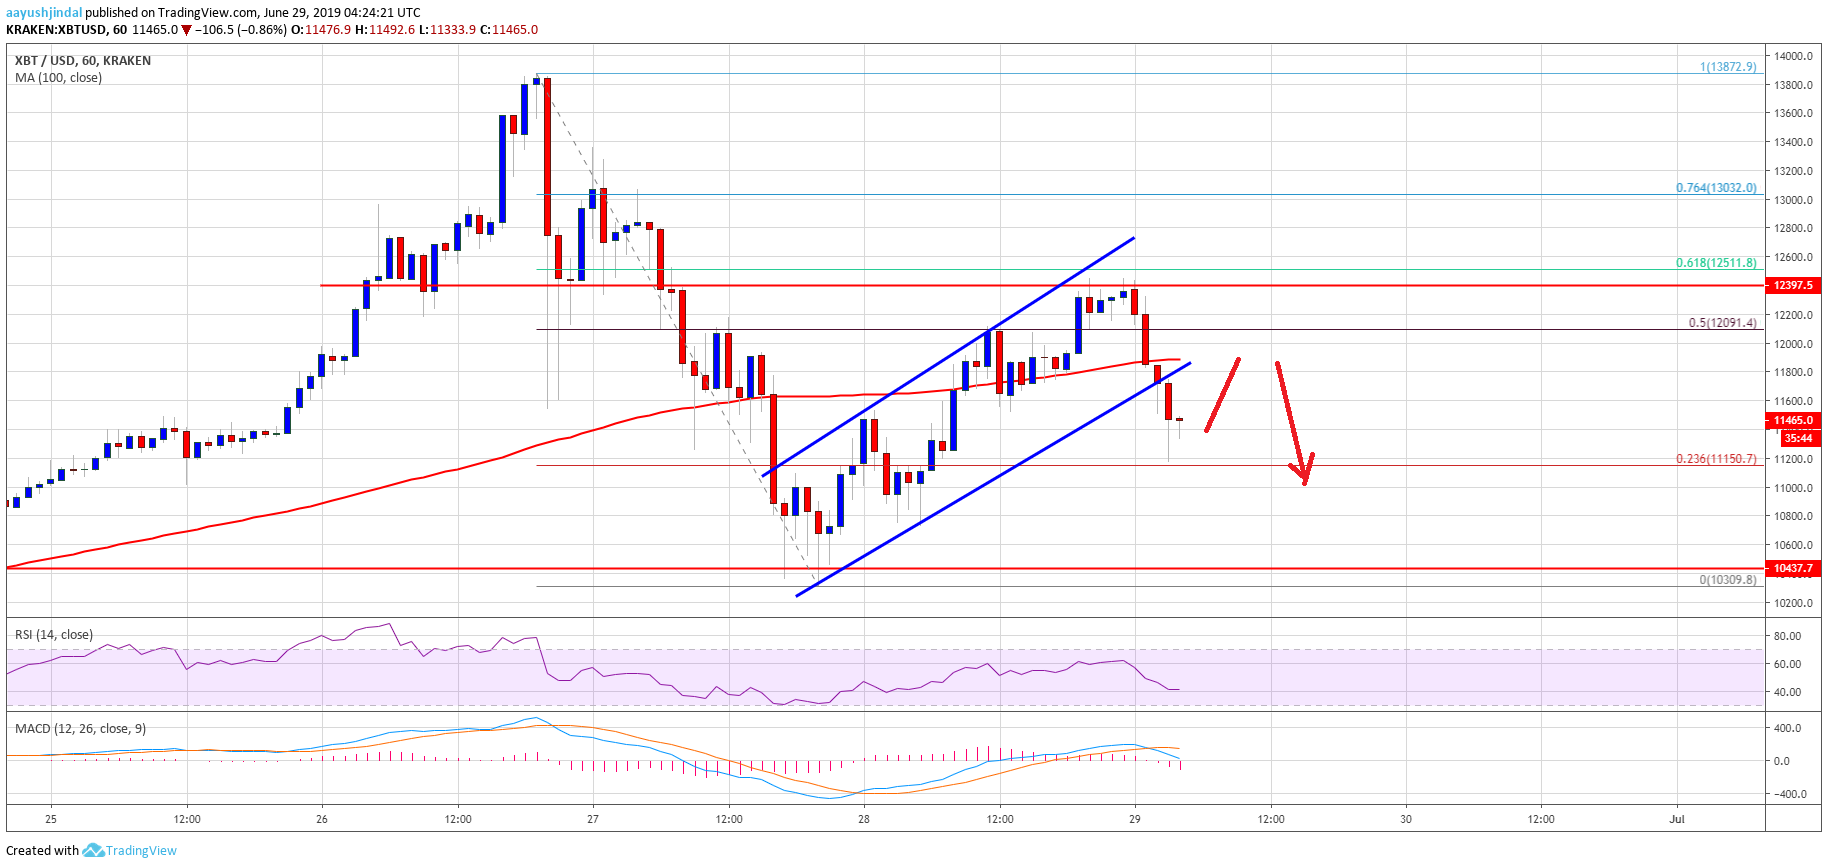
- After correcting towards the $10,400 support, bitcoin price recovered above $11,000 against the US Dollar.
- The price broke the $11,800 resistance, but it faced a strong resistance near the $12,400 level.
- There was a break below an ascending channel with support near $11,800 on the hourly chart of the BTC/USD pair (data feed from Kraken).
- The pair might decline further towards the $11,000 before it could start a fresh increase.
Bitcoin price started a decent recovery above $11,800 against the US Dollar. However, BTC is struggling to settle above $12,000 and the 100 hourly SMA.
Bitcoin Price Analysis
Yesterday, we saw a major decline in bitcoin below the $12,000 and $11,000 supports against the US Dollar. The BTC/USD pair traded close to the $10,000 support area and a swing low was formed near $10,309. A support base was formed above $10,400 and recently the price started an upside correction. It broke the $11,000 resistance to move into a positive zone.
Moreover, the price surpassed the $12,000 level plus the 50% Fib retracement level of the last decline from the $13,872 swing high to $10,309 low. Finally, there was a break above the $12,200 level and the 100 hourly simple moving average. However, the price faced a strong resistance near the $12,400 level. Additionally, the price struggled to test the 61.8% Fib retracement level of the last decline from the $13,872 swing high to $10,309 low. Overall, it topped just below the $12,500 level and recently traded lower.
There was a break below an ascending channel with support near $11,800 on the hourly chart of the BTC/USD pair. The pair is now trading below the $12,000 level and is testing the $11,400 support. It seems like it could correct higher once again towards $12,000. Having said that, it might struggle to surpass the $11,850 level and the 100 hourly SMA.
To start a strong upward move, there must be a close above the $12,000 level and the 100 hourly SMA. If not, there is a risk of a fresh decline below the $11,400 support. The next key support is near the $11,000 level, below which the price might revisit the $10,400 support area.
Looking at the chart, bitcoin price is facing an uphill task below the $12,000 barrier and the 100 hourly SMA. If there is a successful close above $12,000, the price may even attempt to climb above $12,500 in the near term.
Technical indicators:
Hourly MACD – The MACD is slowly moving in the bearish zone.
Hourly RSI (Relative Strength Index) – The RSI for BTC/USD is now well below the 45 level, with a bearish angle.
Major Support Levels – $11,400 followed by $11,000.
Major Resistance Levels – $11,800, $12,000 and $12,500.