
Reason to trust
How Our News is Made
Strict editorial policy that focuses on accuracy, relevance, and impartiality
Ad discliamer
Morbi pretium leo et nisl aliquam mollis. Quisque arcu lorem, ultricies quis pellentesque nec, ullamcorper eu odio.
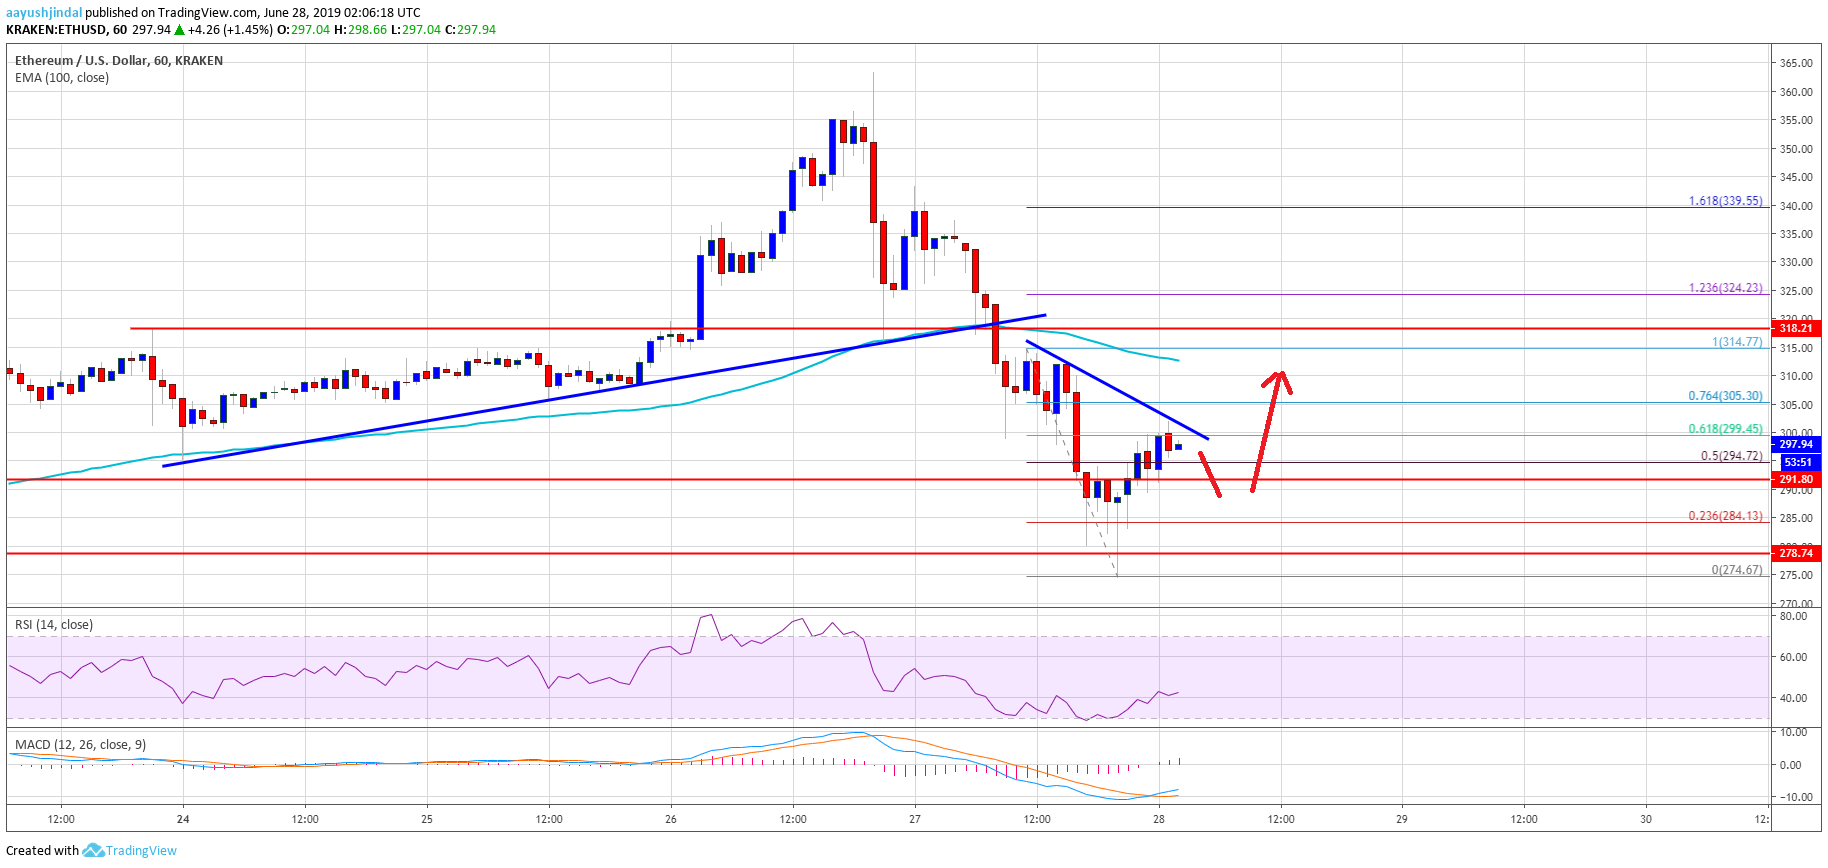
- ETH price topped near the $364 level and declined sharply below $350 against the US Dollar.
- The price is down more than 20% from highs and it is now trading below $310.
- This week’s followed key bullish trend line was breached with support near $318 on the hourly chart of ETH/USD (data feed via Kraken).
- There were sharp losses noted in bitcoin, ripple, bitcoin cash and a few other major altcoins.
Ethereum price is back in a short term bearish zone versus the US Dollar and bitcoin. ETH price could recover above $300, but it is likely to face resistance near $310 or $320.
Ethereum Price Analysis
In the past few sessions, there was a sharp increase in selling on Ethereum and bitcoin against the US Dollar. The ETH/USD pair topped near the $364 level and declined sharply below $350. It broke the main support near the $320 level and the 100 hourly simple moving average. The decline was such that there was a close below the $320 and $318 pivot levels.
Moreover, this week’s followed key bullish trend line was breached with support near $318 on the hourly chart of ETH/USD. Ethereum price is now trading well below the $310 level and it recently declined towards the $275 level. A swing low was formed near $274 and the price is currently correcting higher. It recovered above $290 plus the 50% Fib retracement level of the recent decline from the $314 high to $274 swing low.
However, Ether is facing a strong resistance near the $300 level. Moreover, the 61.8% Fib retracement level of the recent decline from the $314 high to $274 swing low is acting as a hurdle. More importantly, there is a connecting bearish trend line forming with resistance near $300 on the same chart.
It seems like the price may correct higher above $300 in the short term. However, the bulls are likely to face a strong resistance near the $310 and $315 levels. The main resistance is now near $318 and the 100 hourly SMA. A successful close above $320 is needed for the bulls to gain traction.
Looking at the chart, Ethereum price moved back in a bearish zone below $320 and $310. A convincing recovery won’t be easy above $310 or $320. If the price continues to struggle near $300 or $310, there are chances of a fresh decline towards $280 or $275 in the near term.
ETH Technical Indicators
Hourly MACD – The MACD for ETH/USD is slowly moving in the bullish zone.
Hourly RSI – The RSI for ETH/USD is slowly recovering from 30 and it is currently near 42.
Major Support Level – $280
Major Resistance Level – $310


