
Reason to trust
How Our News is Made
Strict editorial policy that focuses on accuracy, relevance, and impartiality
Ad discliamer
Morbi pretium leo et nisl aliquam mollis. Quisque arcu lorem, ultricies quis pellentesque nec, ullamcorper eu odio.
- After setting a new 2019 high near $11,800, bitcoin price declined sharply against the US Dollar.
- The price declined below the key $13,200 and $12,000 supports to trim most gains.
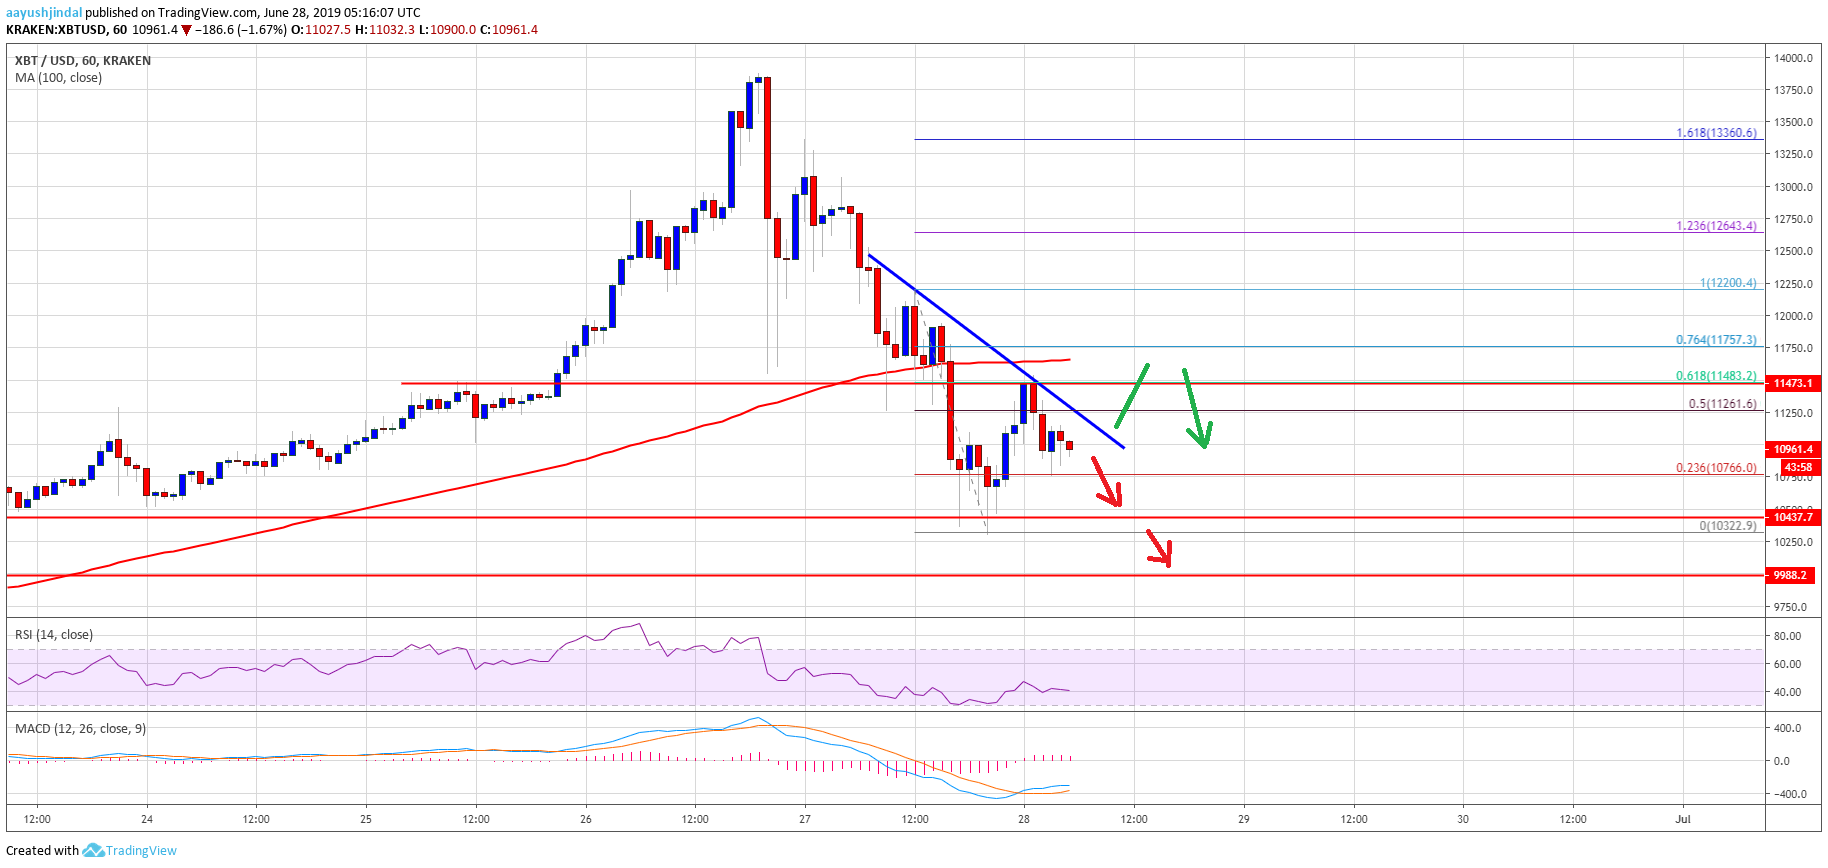
- There is a connecting bearish trend line forming with resistance at $11,100 on the hourly chart of the BTC/USD pair (data feed from Kraken).
- The pair must stay above the $10,450 and $10,000 support levels to start a fresh increase.
Bitcoin price nosedived by more than $2,000 against the US Dollar. BTC is now approaching a couple of important supports near $10,450, $10,200 and $10,000.
Bitcoin Price Analysis
In the past three sessions, bitcoin trimmed most its recent gains from well above $13,000 against the US Dollar. The BTC/USD pair broke the key $12,500 support level to enter a bearish zone. There was even a close below the $11,500 support and the 100 hourly simple moving average. Finally, the price even spiked below the $10,450 support and a new swing low was formed at $10,322.
It recently recovered above the $10,500 and $10,800 levels. Moreover, there was a break above the 50% Fib retracement level of the last decline from the $12,200 swing high to $10,322 low. However, the price struggled to climb above the $11,500 resistance level (the previous support). Besides, the price stayed below the $11,600 pivot and the 100 hourly SMA.
Additionally, the 61.8% Fib retracement level of the last decline from the $12,200 swing high to $10,322 low also prevented gains. More importantly, there is a connecting bearish trend line forming with resistance at $11,100 on the hourly chart of the BTC/USD pair. To start a fresh increase, the price must break the trend line and the $11,500 resistance. Having said that, a successful close above the 100 hourly SMA is needed for more gains towards $12,000 and $12,500.
Conversely, if the price fails to move past $11,500, it could continue to decline. An immediate support is near the $10,450 level. The main supports are near $10,200, $10,000 and $9,980. If there is a break below the $9,980 support, the price could accelerate losses in the near term. The next main support is at $9,920, followed by $8,500.
Looking at the chart, bitcoin price is clearly struggling below the $11,500 and $12,000 levels. However, the $10,000 support level holds the key. As long as BTC price is above the $10,000 support, it could consolidate and then start a fresh increase.
Technical indicators:
Hourly MACD – The MACD is slowly moving in the bullish zone.
Hourly RSI (Relative Strength Index) – The RSI for BTC/USD is now well below the 50 level, with a bearish angle.
Major Support Levels – $10,450 followed by $10,000.
Major Resistance Levels – $11,100, $11,500 and $12,000.