
Reason to trust
How Our News is Made
Strict editorial policy that focuses on accuracy, relevance, and impartiality
Ad discliamer
Morbi pretium leo et nisl aliquam mollis. Quisque arcu lorem, ultricies quis pellentesque nec, ullamcorper eu odio.
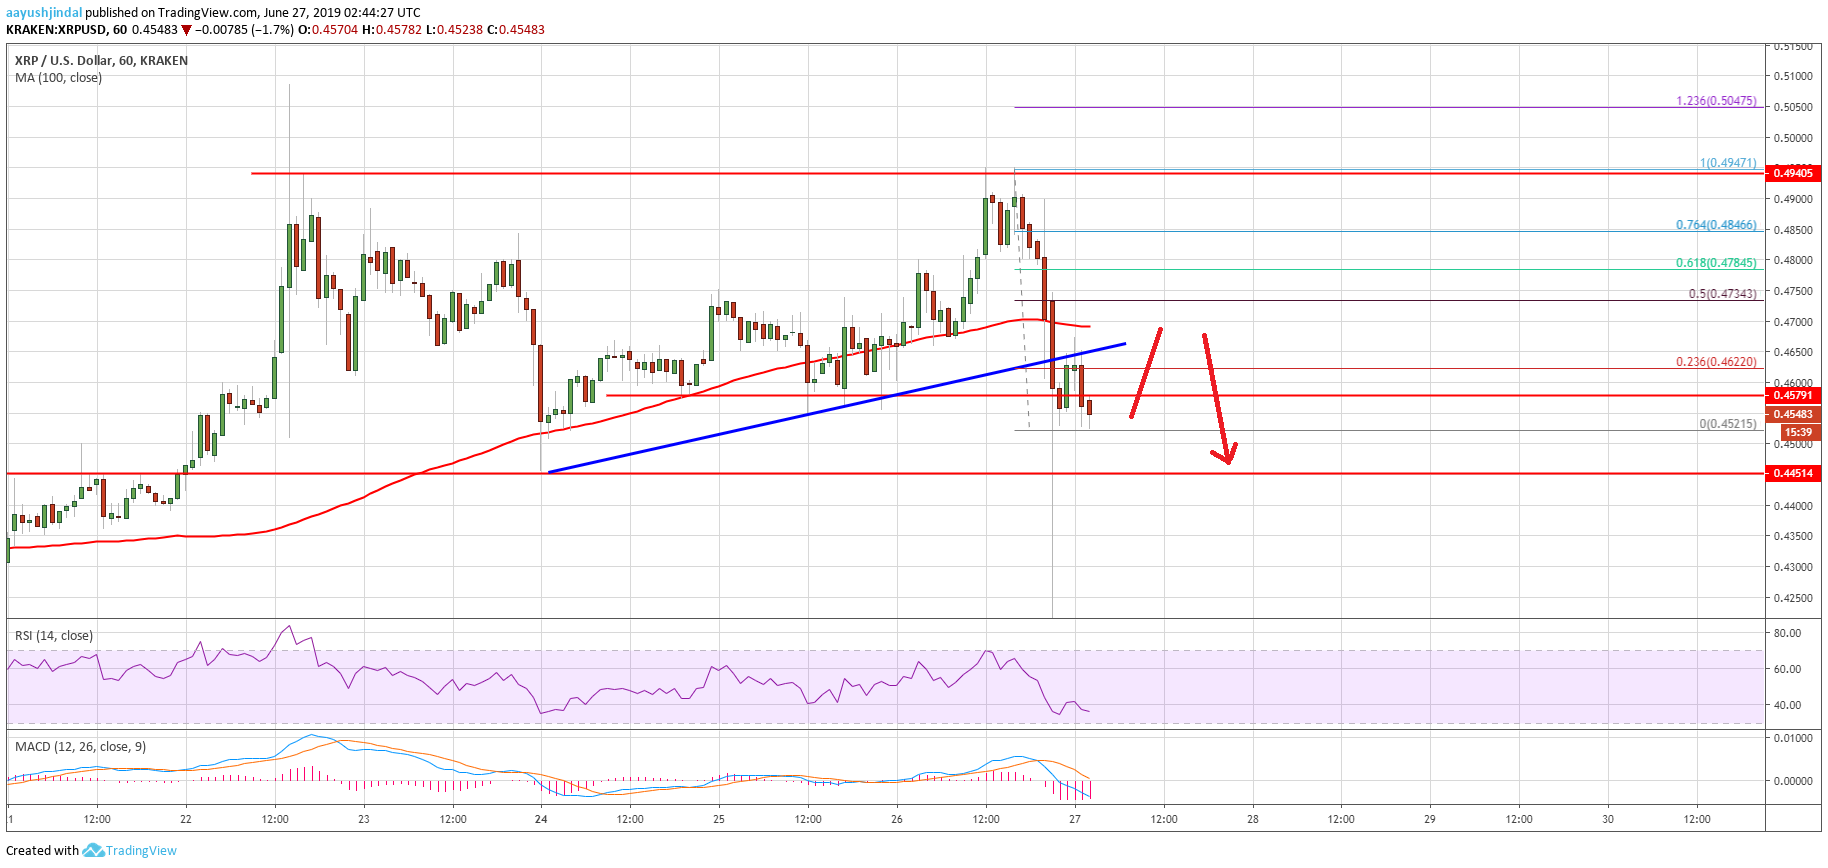
- Ripple price failed to climb above the key $0.4950 resistance level and declined against the US dollar.
- The price broke the $0.4700 support and it is currently struggling to hold the $0.4500 support.
- There was a break below a major bullish trend line with support at $0.4690 on the hourly chart of the XRP/USD pair (data source from Kraken).
- Ethereum price corrected gains, but it is holding the key $320 support very well.
Ripple price is struggling to hold a few important supports against the US Dollar, while bitcoin is correcting gains. XRP price remains at a risk of more losses below $0.4500.
Ripple Price Analysis
Recently, bitcoin price climbed sharply above $13,000 (as discussed yesterday), but ripple price struggled to gather pace against the US Dollar. The XRP/USD pair climbed above the $0.4800 level and traded close to the $0.5000 resistance. However, the $0.4950 resistance area acted as a strong hurdle for the bulls. A swing high was formed at $0.4947 and the price recently declined heavily.
There were back to back bearish candles below the $0.3800 support. Ripple price even traded below the $0.3700 support. Finally, there was a close below the $0.4650 level and the 100 hourly simple moving average. A swing low was formed near $0.4521 and the price is currently consolidating losses. An initial resistance is near the $0.4620 level. It coincides with the 23.6% Fib retracement level of the downward move from the $0.4947 high to $0.4521 low.
However, the main resistance is near the broken trend line and $0.4700. Moreover, the 100 hourly simple moving average is also positioned near the $0.4700 level. Finally, the 50% Fib retracement level of the downward move from the $0.4947 high to $0.4521 low is at $0.4735 to prevent an upward move. If there is a close above the $0.4750 level, ripple could rise towards the $0.4950 level.
Conversely, if XRP continues to struggle below $0.4700, there could be more downsides. An immediate support is at $0.4520, below which there is a risk of a downside break below the $0.4500 support.
Looking at the chart, ripple price is clearly facing a strong selling interest below $0.4700. If the price stays above $0.4700, there could be more losses. On the other hand, if bitcoin price climbs higher again, it could stop declines in ripple below the $0.4500 support.
Technical Indicators
Hourly MACD – The MACD for XRP/USD is currently placed heavily in the bearish zone.
Hourly RSI (Relative Strength Index) – The RSI for XRP/USD is currently well below the 50 level, with a bearish angle.
Major Support Levels – $0.4520, $0.4500 and $0.4450.
Major Resistance Levels – $0.4620, $0.4700 and $0.4750.


