
Reason to trust
How Our News is Made
Strict editorial policy that focuses on accuracy, relevance, and impartiality
Ad discliamer
Morbi pretium leo et nisl aliquam mollis. Quisque arcu lorem, ultricies quis pellentesque nec, ullamcorper eu odio.
- There was a fresh increase in bitcoin and it broke the $11,250 resistance against the US Dollar.
- The price traded to a new 2019 high and it is likely to accelerate above the $11,500 resistance.
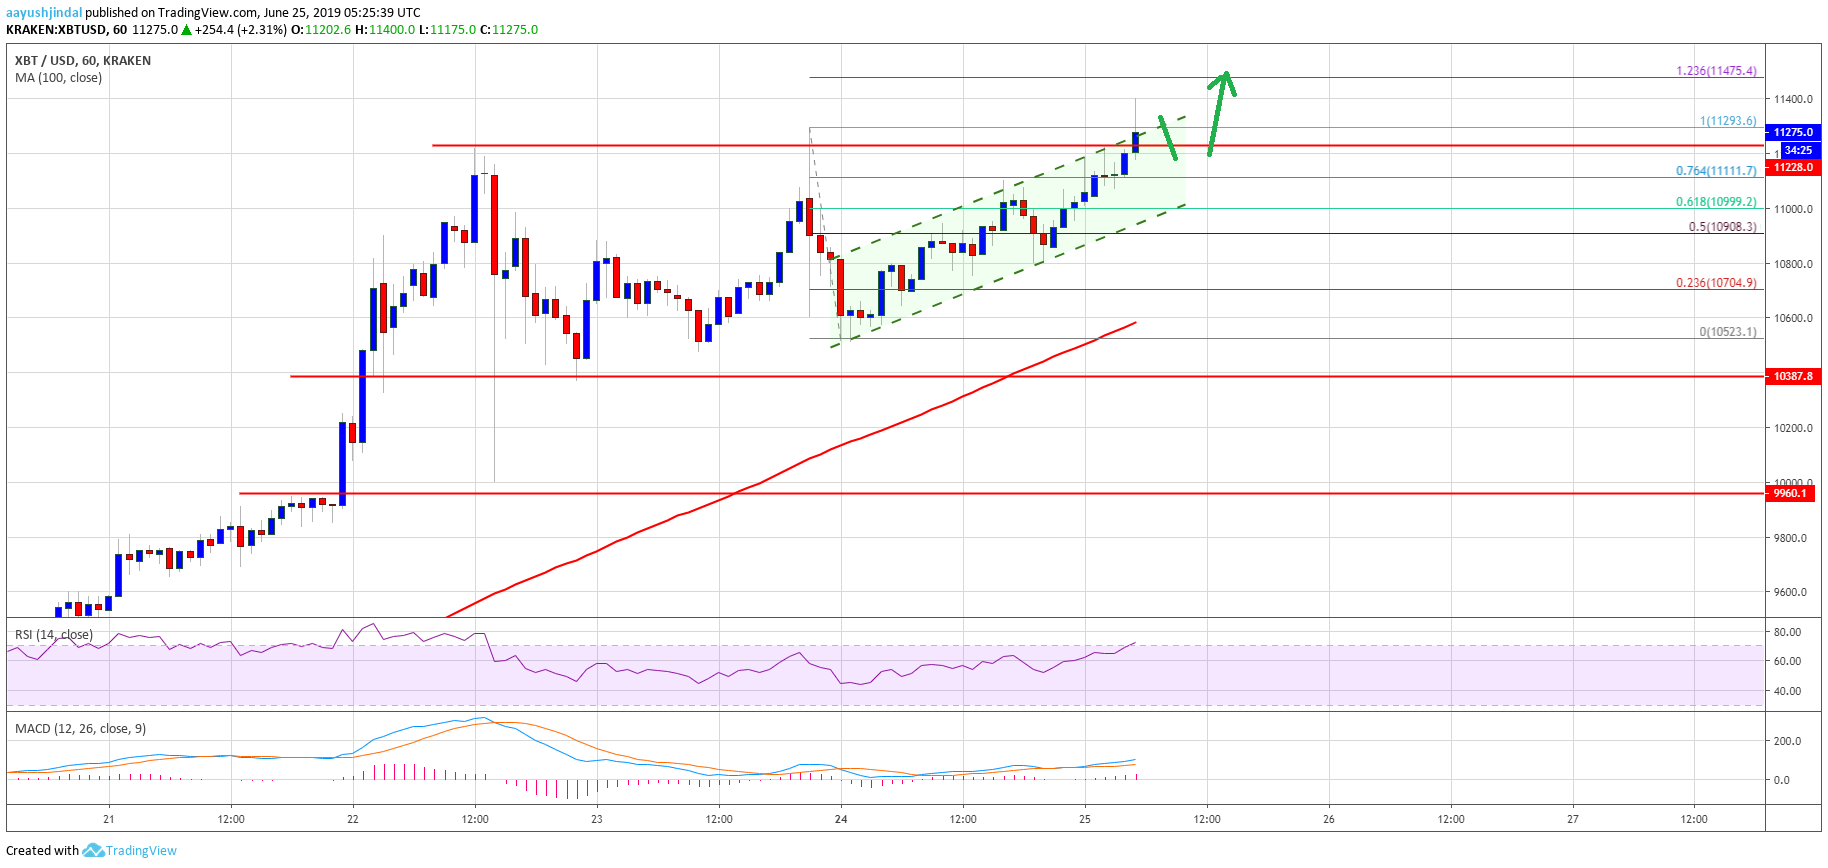
- There was a break above an ascending channel with resistance near $11,250 on the hourly chart of the BTC/USD pair (data feed from Kraken).
- The pair is gaining momentum and it could even trade towards the $12,000 level in the near term.
Bitcoin price is trading with a bullish angle above $11,200 against the US Dollar. BTC price could continue to accelerate gains as the bulls eye more gains above $11,500.
Bitcoin Price Analysis
After a short term downside correction, bitcoin found support near the $10,525 level against the US Dollar. The BTC/USD pair formed a swing low at $10,523 and it recently climbed above the $10,800 and $11,000 resistance levels. The price is gaining momentum and it recently broke the $11,250 resistance. Moreover, there was a break above the 76.4% Fib retracement level of the last drop from the $11,293 high to $10,523 low. Similarly, there were gains in Ethereum and ripple.
BTC is now trading well above the $11,200 level and the 100 hourly simple moving average. Besides, there was a break above an ascending channel with resistance near $11,250 on the hourly chart of the BTC/USD pair. As a result, the price surpassed the last swing high at $11,293 and traded to a new 2019 high above $11,300.
The price is clearly trading with a positive bias above the $11,200 and $11,250 levels. If it continues to grind higher, the next stop for the bulls could be near the $11,475 level. It represents the 1.236 Fib extension level of the last drop from the $11,293 high to $10,523 low. However, there are high chances of an upside break above the $11,500 and $11,600 level.
Therefore, the price may even trade towards the key $12,000 level in the near term. On the downside, an initial support is near the $11,200 level, below which bitcoin could test the $11,000 level. If there are more losses, the price could test the channel support near the $10,980 level.
Looking at the chart, bitcoin price is showing a lot of bullish signs above $11,200. The bulls are currently in action and it seems like they are eyeing a fresh increase above the $11,300 and $11,400 levels in the coming sessions.
Technical indicators:
Hourly MACD – The MACD is currently gaining strength in the bullish zone.
Hourly RSI (Relative Strength Index) – The RSI for BTC/USD is now above the 65 level, with a bullish angle.
Major Support Levels – $11,200 followed by $11,000.
Major Resistance Levels – $11,300, $11,475 and $11,600.


