
Reason to trust
How Our News is Made
Strict editorial policy that focuses on accuracy, relevance, and impartiality
Ad discliamer
Morbi pretium leo et nisl aliquam mollis. Quisque arcu lorem, ultricies quis pellentesque nec, ullamcorper eu odio.
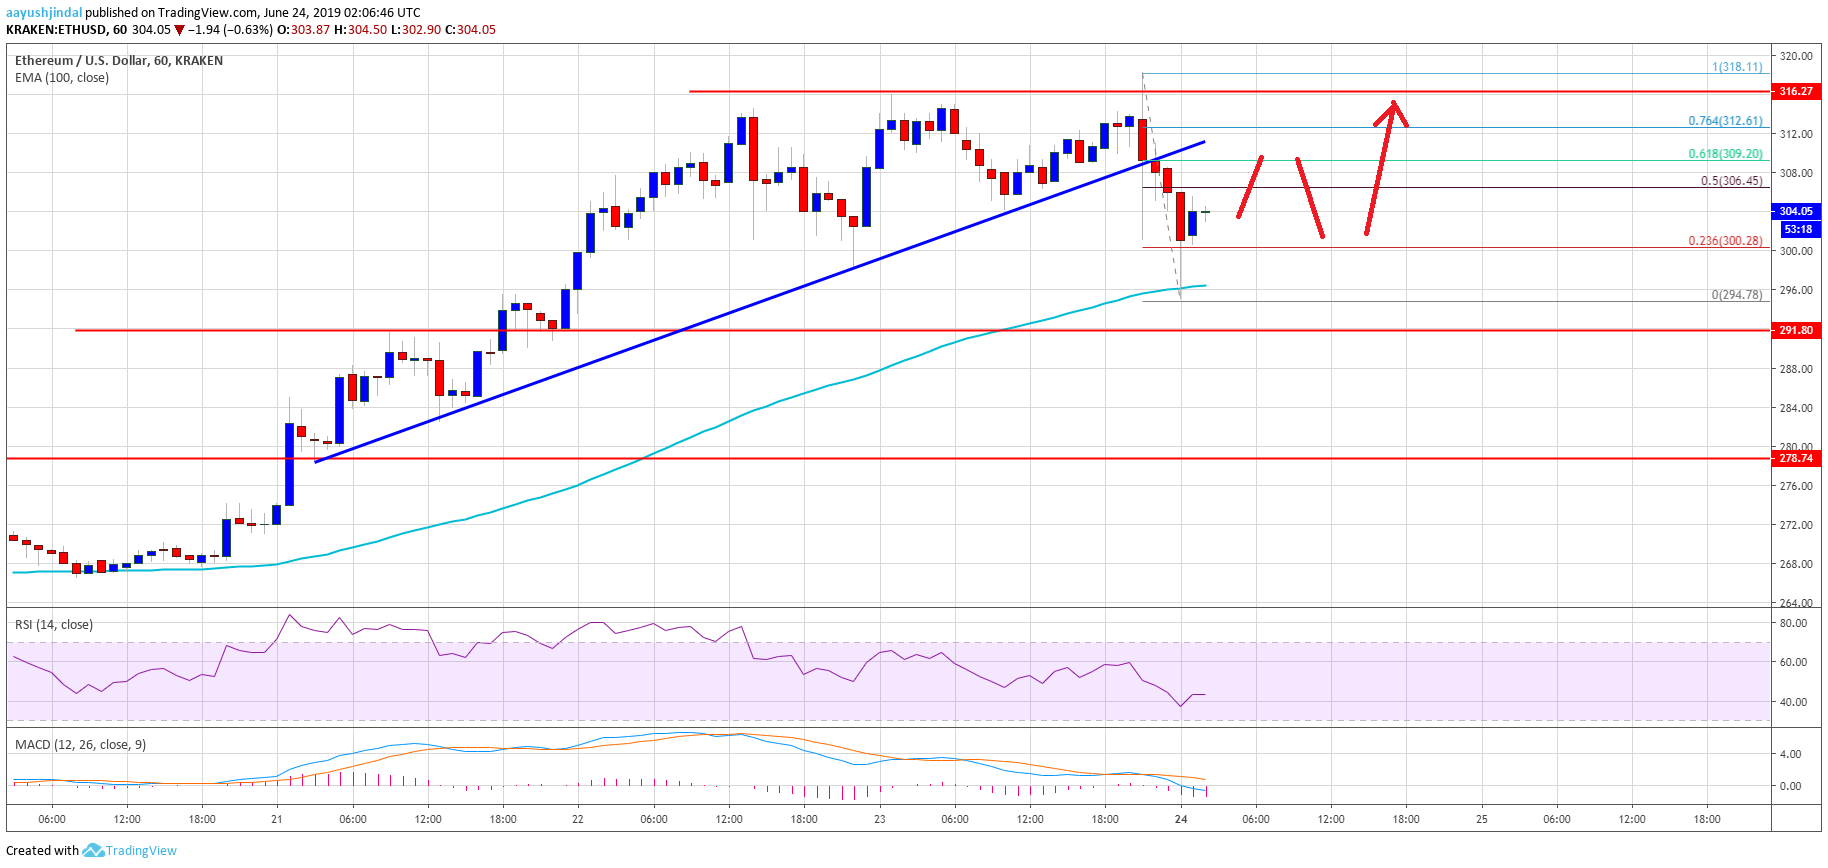
- ETH price climbed sharply above $300, but it struggled to clear the $315-320 resistance against the US Dollar.
- The price corrected lower, declined below the $300 level, and found support near the $295 level.
- There was a break below a major bullish trend line with support near $310 on the hourly chart of ETH/USD (data feed via Kraken).
- The pair is currently correcting higher, but there are chances of more ranges moves below $320.
Ethereum price is currently consolidating gains in a broad range versus the US Dollar, just like bitcoin. ETH price must stay above $295 and $290 to climb higher once again.
Ethereum Price Analysis
This past week, we saw solid gains in bitcoin and Ethereum above $300 and $10,000 respectively against the US Dollar. The ETH/USD pair gained momentum above the $305 and $310 levels. There was even a close above the $300 level and the 100 hourly simple moving average. The price traded close to the $320 level and a swing high was formed near $318.
It seems like the price struggled to continue above the $315-320 resistance area. As a result, there was a downside correction below the $310 level. There was a break below a major bullish trend line with support near $310 on the hourly chart of ETH/USD. Ethereum price even declined below the $300 support levels. However, the 100 hourly SMA acted as a strong support near the $295 level.
A swing low is formed at $295 and the price is currently moving higher. It is trading above the 23.6% Fib retracement level of the downward move from the $318 high to $295 swing low. On the upside, there are a few hurdles for the bulls near $306 and $310. The 50% Fib retracement level of the downward move from the $318 high to $295 swing low is near the $306 level to prevent upsides.
Moreover, the main resistance is near the $310 level. Therefore, ETH must climb above the $310 level to start a fresh increase. The next key resistances are near $315 and $320, above which the price may perhaps accelerate higher.
Looking at the chart, Ethereum price is facing a lot of resistance below $310. Therefore, there are chances of range moves before the next move (probably above $310 and $315). On the downside, the main support is near the $295 level and the 100 hourly SMA, followed by $290.
ETH Technical Indicators
Hourly MACD – The MACD for ETH/USD is currently gaining strength in the bearish zone.
Hourly RSI – The RSI for ETH/USD is currently below the 50 level, with a few positive signs.
Major Support Level – $295
Major Resistance Level – $310


