
Reason to trust
How Our News is Made
Strict editorial policy that focuses on accuracy, relevance, and impartiality
Ad discliamer
Morbi pretium leo et nisl aliquam mollis. Quisque arcu lorem, ultricies quis pellentesque nec, ullamcorper eu odio.
- There were sharp gains in BTC to USD above the $10,000 level against the US Dollar.
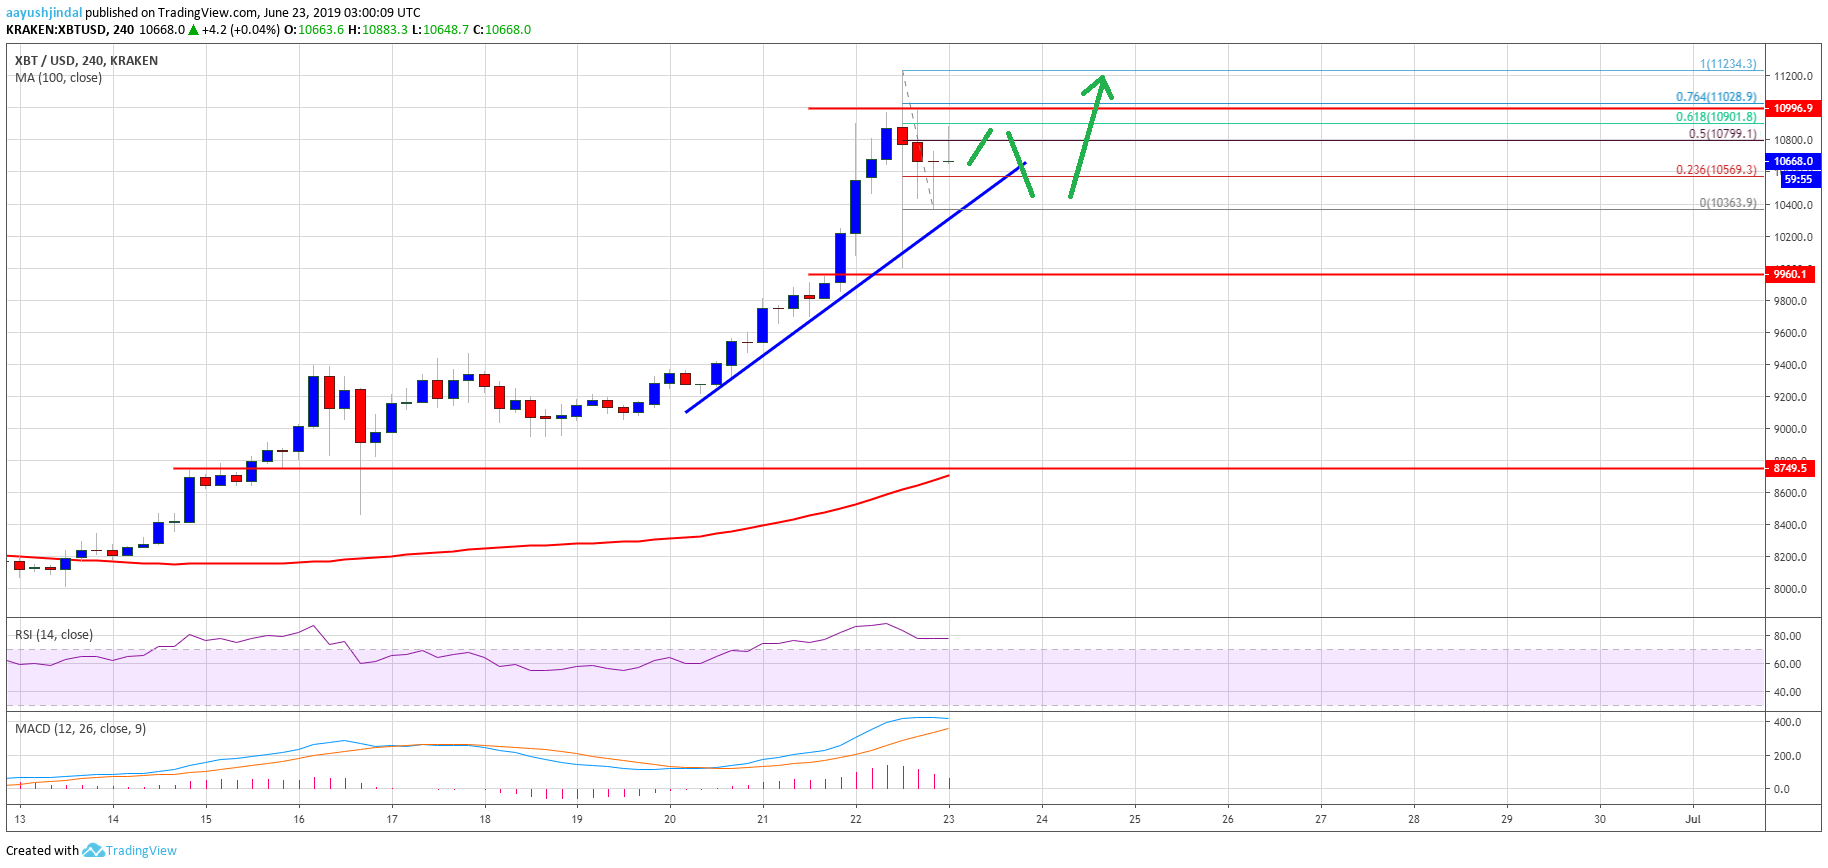
- The price traded to a new 2019 high above the $11,000 level at $11,234.
- There is a key bullish trend line forming with support near $10,550 on the 4-hours chart of the BTC/USD pair (data feed from Kraken).
- The pair is currently trading above the $9,000 level and it could continue higher towards the $10,000 level.
Bitcoin price is surging and it recently topped near the $11,200 level against the US Dollar. BTC could consolidate in the short term before a fresh increase above $11,000.
Bitcoin Price Weekly Analysis (BTC)
This past week, bitcoin price started a strong rally above the $8,500 and $9,000 resistances against the US Dollar. The BTC/USD pair even gained strength above the $10,000 and $10,500 levels. Finally, there was a break above the $11,000 level and the price settled well above the 100 simple moving average (4-hours). Finally, the price formed a new 2019 high near $11,200 and recently started a downside correction.
It declined below $11,000 and $10,800. However, the $10,400 level acted as a decent support and a swing low was formed at $10,363. The price is currently moving higher and it trading near the $10,700 level. It is above the 23.6% Fib retracement level of the recent correction from the $11,234 high to $10,363 low. However, it seems like the $10,800 and $10,950 levels are currently capping gains.
The 50% Fib retracement level of the recent correction from the $11,234 high to $10,363 low is also preventing gains. If there is a successful break above $10,950 and a follow through above $11,000, the price is likely to resume its uptrend. The next key resistances are near $11,200 and $11,500. If bitcoin price continues to rise, it could even test the key $12,000 level in the near term.
On the downside, there are many supports near $10,500. Moreover, there is a key bullish trend line forming with support near $10,550 on the 4-hours chart of the BTC/USD pair. If bitcoin slides below the trend line, it could revisit the $10,200 and $10,000 support levels.
Looking at the chart, bitcoin price seems to be currently correcting gains. It remains well supported above $10,000 and there are chances of a fresh increase above $11,000. The bulls are likely to target further gains and just like the 2017 bull-run, the price might soon accelerate above $11,200.
Technical indicators
4 hours MACD – The MACD for BTC/USD is slowly reducing its bullish slope.
4 hours RSI (Relative Strength Index) – The RSI for BTC/USD is currently in the overbought zone, with a few bearish signs.
Major Support Level – $10,500
Major Resistance Level – $11,000