
Reason to trust
How Our News is Made
Strict editorial policy that focuses on accuracy, relevance, and impartiality
Ad discliamer
Morbi pretium leo et nisl aliquam mollis. Quisque arcu lorem, ultricies quis pellentesque nec, ullamcorper eu odio.
- Bitcoin price rallied recently above the key $10,000 resistance area against the US Dollar.
- The price is currently trading well above the $10,600 level and it could continue to climb in the near term.
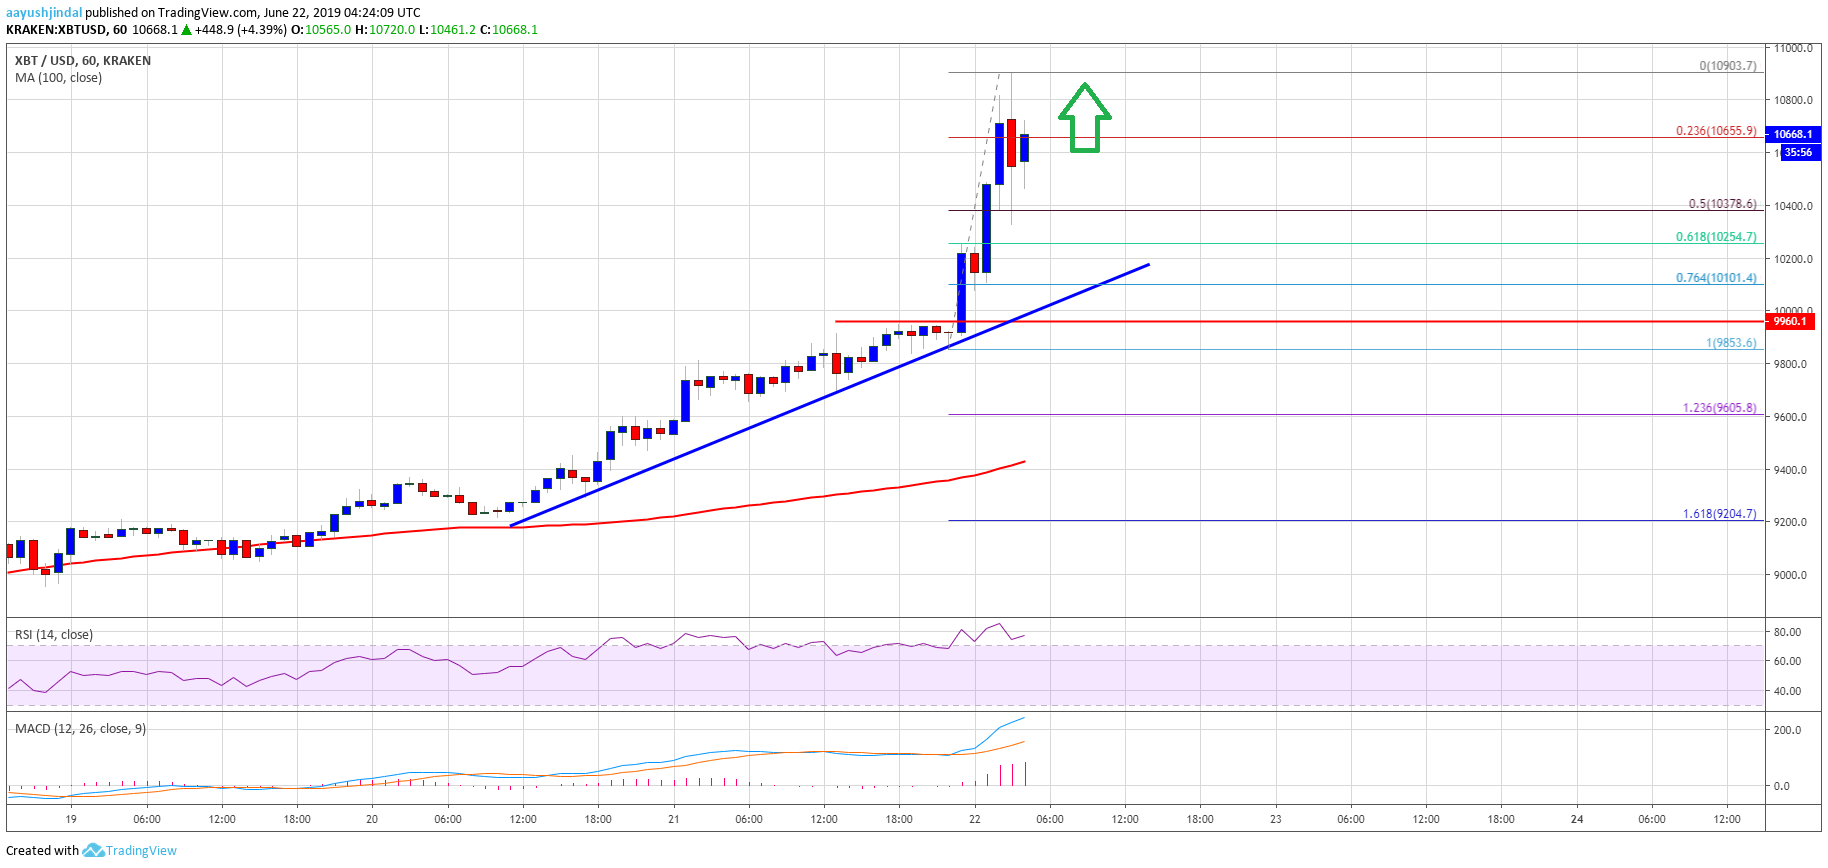
- There is a key bullish trend line forming with support near $10,200 on the hourly chart of the BTC/USD pair (data feed from Kraken).
- The pair is likely to rally further above the $11,000 mark to register a solid uptrend.
Bitcoin price gained more than 10% in the past 24 hours and broke $10K against the US Dollar. BTC is likely to continue higher towards the $11,000 and $12,000 levels.
Bitcoin Price Analysis
Yesterday, we saw a solid upward move above $9,500 in bitcoin price against the US Dollar. The BTC/USD pair remained in a positive zone and recently rallied above the main $10,000 resistance. There was even a close above the $10,000 level and the 100 hourly simple moving average. A new 2019 high was formed above $10,800 and the price traded close to the $11,000 level.
The recent rise was convincing since there was a strong follow through above $10,000. The bulls are currently in action despite the recent downside correction. It broke the $10,700 support plus the 23.6% Fib retracement level of the recent rally from the $9,853 low to $10,903 high. However, the decline was protected by the $10,400 support area.
It seems like the 50% Fib retracement level of the recent rally from the $9,853 low to $10,903 high acted as a strong support. Moreover, there is a key bullish trend line forming with support near $10,200 on the hourly chart of the BTC/USD pair. The pair is currently moving higher and is trading above the $10,600 level. On the upside, an immediate hurdle is near the $10,800 level, above which the price could trade towards the $11,000 level.
Moreover, if the bulls remain in action, the price may even climb above the $11,000 and $11,200 levels. On the downside, there are many supports near the $10,600 and $10,400 levels. The main support is now near $10,000.
Looking at the chart, bitcoin price is clearly in a strong uptrend above $10,000. If there are more gains, the price may even test the next important resistance near $12,000. On the downside, the previous resistances near $9,800 and $9,500 are now pivot levels. Only a daily close below $9,500 might start a major decline.
Technical indicators:
Hourly MACD – The MACD is currently now heavily in the bullish zone.
Hourly RSI (Relative Strength Index) – The RSI for BTC/USD is currently in the extreme overbought zone.
Major Support Levels – $10,600 followed by $10,400.
Major Resistance Levels – $10,800, $11,000 and $11,200.