
Reason to trust
How Our News is Made
Strict editorial policy that focuses on accuracy, relevance, and impartiality
Ad discliamer
Morbi pretium leo et nisl aliquam mollis. Quisque arcu lorem, ultricies quis pellentesque nec, ullamcorper eu odio.
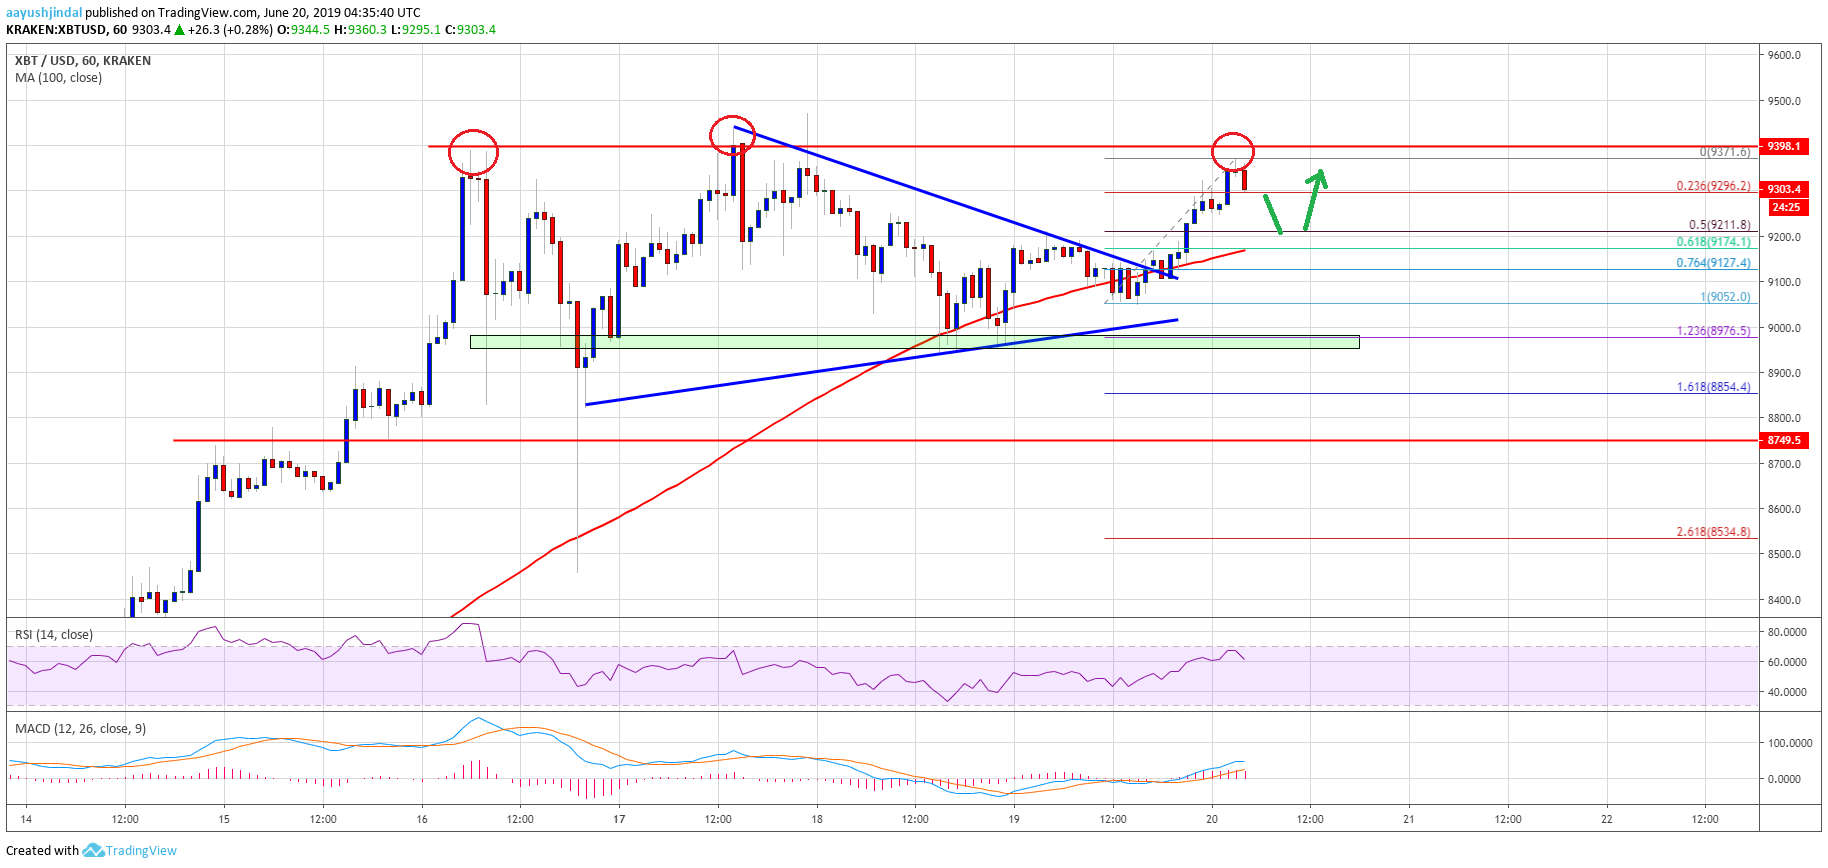
- Bitcoin price stayed above the key $9,000 support and traded higher recently against the US Dollar.
- The price traded above the $9,300 resistance and it recently tested the $9,400 resistance area.
- There was a break above a major contracting triangle with resistance near $9,130 on the hourly chart of the BTC/USD pair (data feed from Kraken).
- The pair is likely to climb sharply higher once it clears the $9,390 and $9,400 resistance levels.
Bitcoin price is trading with a bullish tone above $9,300 against the US Dollar. BTC is likely to trade to a new 2019 high this week as long as it is above $9,050.
Bitcoin Price Analysis
After forming a support base near $9,000, bitcoin price started a fresh increase against the US Dollar. The BTC/USD pair traded higher above the $9,100 and $9,120 resistance levels. A swing low was formed at $9,052 and the price recently settled above $9,200. It even traded above the $9,300 level and is currently trading well above the 100 hourly simple moving average.
Moreover, there was a break above a major contracting triangle with resistance near $9,130 on the hourly chart of the BTC/USD pair. On the upside, the $9,400 area seems to be acting as a crucial barrier. The recent high was formed at $9,371 and the price is currently correcting lower. It is testing the 23.6% Fib retracement level of the upward move from the $9,052 low to $9,371 high.
On the downside, there are a few key supports visible near the $9,200 and $9,175 levels. Moreover, an immediate support is $9,210 and the 50% Fib retracement level of the upward move from the $9,052 low to $9,371 high. If there are more losses, the price might test the $9,175 support and the 100 hourly simple moving average.
Besides, the 61.8% Fib retracement level of the upward move from the $9,052 low to $9,371 high is also near $9,175. Therefore, as long as the price is above $9,175, it could make another attempt to surpass the $9,375 and $9,400 levels. If it succeeds, there could be a new 2019 high above the $9,450 level.
Looking at the chart, bitcoin price seems to be trading in a broad range below the $9,400 resistance. The main range supports are near $9,050 and $9,000. If there is a daily close below the $9,000 level, the price could start an extended downside correction towards $8,750 in the near term.
Technical indicators:
Hourly MACD – The MACD is currently gaining momentum in the bullish zone.
Hourly RSI (Relative Strength Index) – The RSI for BTC/USD is currently correcting lower towards the 60 level.
Major Support Levels – $9,210 followed by $9,175.
Major Resistance Levels – $9,375, $9,400 and $9,450.