
Reason to trust
How Our News is Made
Strict editorial policy that focuses on accuracy, relevance, and impartiality
Ad discliamer
Morbi pretium leo et nisl aliquam mollis. Quisque arcu lorem, ultricies quis pellentesque nec, ullamcorper eu odio.
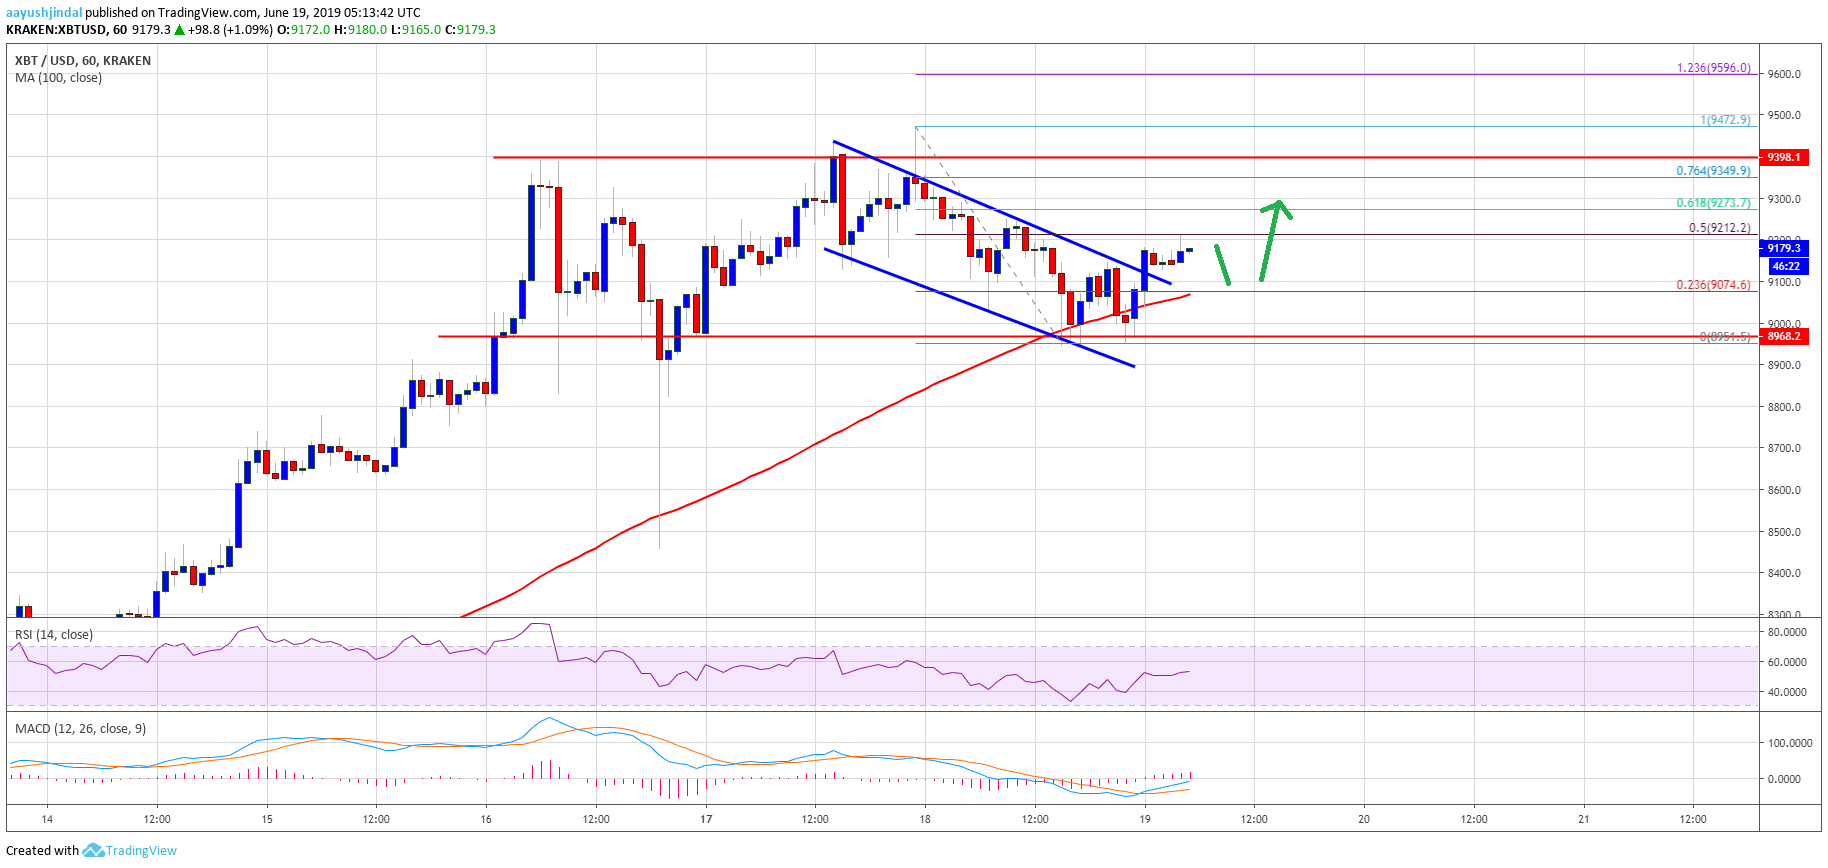
- Bitcoin price started a downside correction below the $9,200 support against the US Dollar.
- The price tested the $8,950 support area and it is currently moving higher towards $9,200.
- There was a break above a declining channel with resistance at $9,120 on the hourly chart of the BTC/USD pair (data feed from Kraken).
- The pair is showing positive signs and it could continue to rise if it breaks the $9,275 resistance.
Bitcoin price is currently moving higher and likely completed a downside correction against the US Dollar. BTC must break $9,220 and $9,275 to continue higher in the near term.
Bitcoin Price Analysis
After setting a new 2019 high near $9,472, bitcoin price started a downside correction against the US Dollar. The BTC/USD pair broke the $9,300 and $9,200 support levels to start the recent correction. It even spiked below the $9,000 support and the 100 hourly simple moving average. However, downsides were limited and the price formed a swing low near the $8,951 level.
The price is currently climbing higher and is trading above $9,050 plus the 100 hourly simple moving average. There was a break above the 23.6% Fib retracement level of the recent decline from the $9,472 high to $8,951 low. Moreover, there was a break above a declining channel with resistance at $9,120 on the hourly chart of the BTC/USD pair.
The pair is currently testing the 50% Fib retracement level of the recent decline from the $9,472 high to $8,951 low. If there is an upside break above the $9,220 level, the price could continue to rise in the near term. The next immediate resistance is near $9,275. It is near the 61.8% Fib retracement level of the recent decline from the $9,472 high to $8,951 low.
Therefore, a successful close above $9,275 might push the price towards the last swing high at $9,472. On the downside, an initial support is near the $9,070 level and the 100 hourly SMA. The main supports are $9,000 and $8,950, below which the price may perhaps extend its downside correction.
Looking at the chart, bitcoin price successfully held the $9,000 support area despite a couple of spikes. As long as the price is holding the $9,000 support and the $8,950 pivot, it could climb higher towards $9,400 and $9,500. Conversely, a downside break below $8,950 could put pressure on the bulls. The next key support is near the $8,740 level.
Technical indicators:
Hourly MACD – The MACD is slowly gaining momentum in the bullish zone.
Hourly RSI (Relative Strength Index) – The RSI for BTC/USD is currently just above the 50 level.
Major Support Levels – $9,070 followed by $9,000.
Major Resistance Levels – $9,220, $9,275 and $9,400.


