Reason to trust
How Our News is Made
Strict editorial policy that focuses on accuracy, relevance, and impartiality
Ad discliamer
Morbi pretium leo et nisl aliquam mollis. Quisque arcu lorem, ultricies quis pellentesque nec, ullamcorper eu odio.
- ETH price is struggling to gain momentum above $275 and $280 against the US Dollar.
- The price is currently correcting lower towards the $268 and $265 support levels.
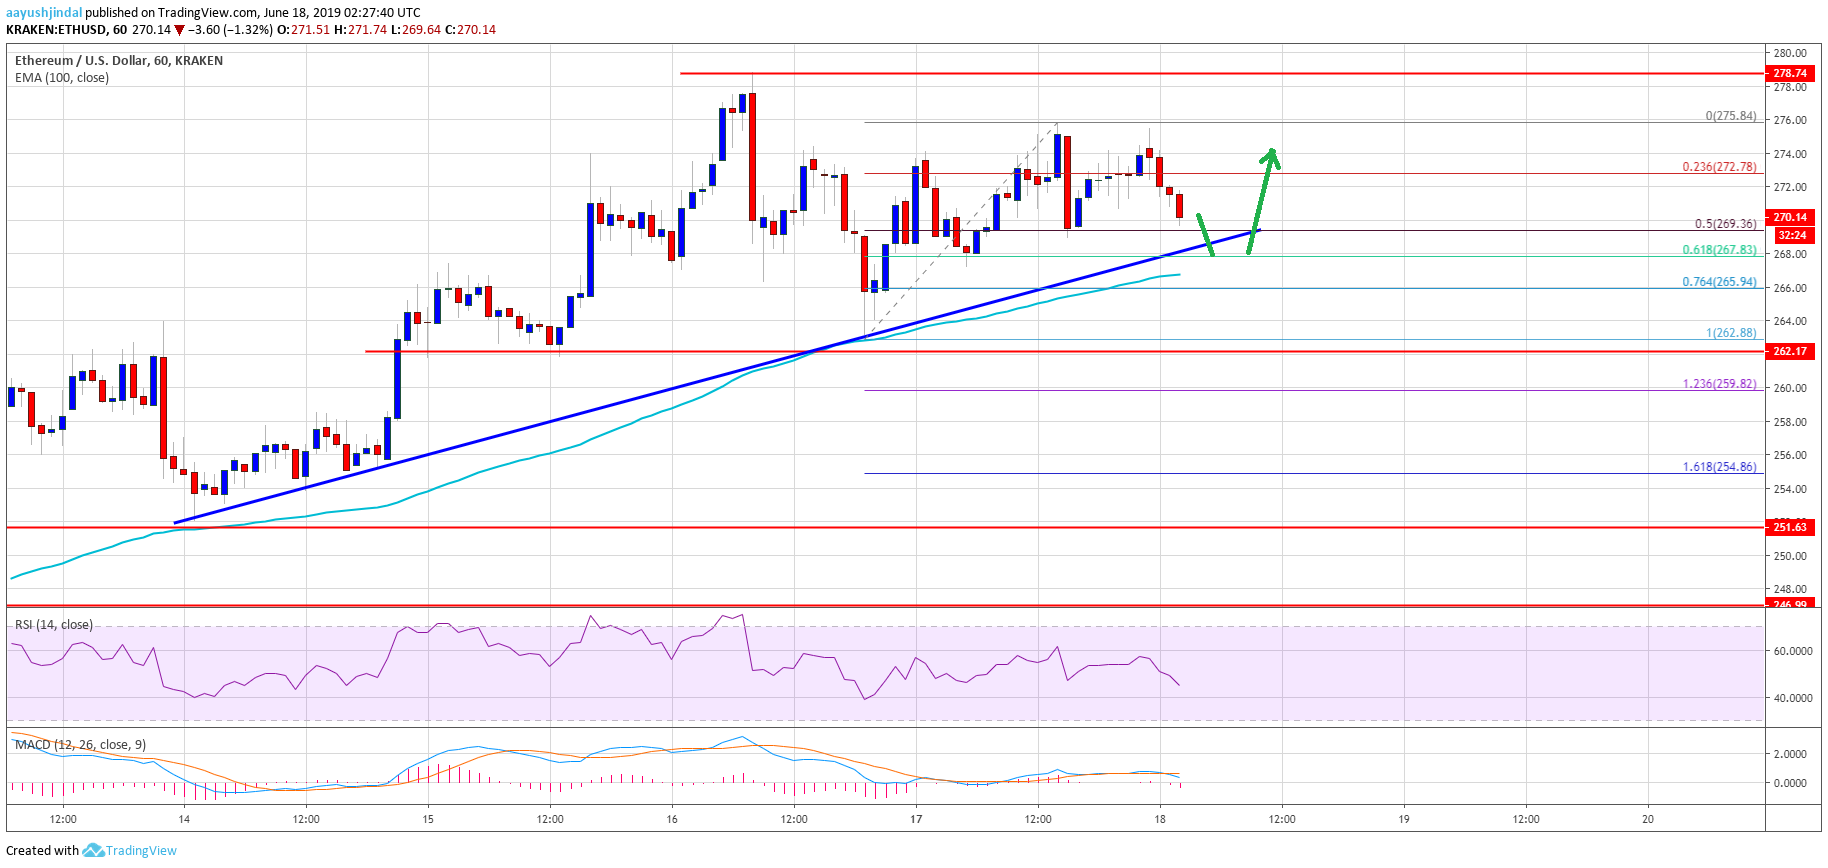
- Yesterday’s highlighted key bullish trend line is intact with support near $267 on the hourly chart of ETH/USD (data feed via Kraken).
- The pair is likely to find a strong buying interest near the $268, $267 and $265 support levels.
Ethereum price is trading in a broad range below $275 versus the US Dollar, but extended losses vs bitcoin. ETH price could start a strong rally if there is a clear break above $275 and $280.
Ethereum Price Analysis
After a short term downside correction, Ethereum price recovered from the $262 swing low against the US Dollar. The ETH/USD pair traded above the $265 and $270 resistance levels. Moreover, the price remained well above the $270 level and the 100 hourly simple moving average. However, the price struggled to clear the key $275 resistance level and recently corrected lower once again.
It traded below the 23.6% Fib retracement level of the upward move from the $262 swing low to $275 high. There were a couple of spikes below $270, but the price remained well bid above $268. Besides, the 50% Fib retracement level of the upward move from the $262 swing low to $275 high acted as a strong support. More importantly, yesterday’s highlighted key bullish trend line is intact with support near $267 on the hourly chart of ETH/USD.
The main support is near the $266 and $265 levels. The 100 hourly SMA is positioned near the $265 level to act as a solid support. An intermediate support is near the 61.8% Fib retracement level of the upward move from the $262 swing low to $275 high. Therefore, the price is likely to bounce back as long as it is above the $265 support.
On the upside, the main resistance is near the $275 level. If there is an upside break above $275, there are chances of more upsides above the $278 and $280 levels in the near term.
Looking at the chart, Ethereum price is clearly struggling to gain momentum above $275 and $280. A successful close above the $280 barrier is must for a sharp rise towards the $290 and $300 resistance levels. On the downside, if there is a break below the $265 support, the price is likely to continue lower in the coming sessions.
ETH Technical Indicators
Hourly MACD – The MACD for ETH/USD is slowly gaining pace in the bearish bullish zone, with negative signs.
Hourly RSI – The RSI for ETH/USD just dipped below the 50 level, with a bearish angle.
Major Support Level – $265
Major Resistance Level – $275