
Reason to trust
How Our News is Made
Strict editorial policy that focuses on accuracy, relevance, and impartiality
Ad discliamer
Morbi pretium leo et nisl aliquam mollis. Quisque arcu lorem, ultricies quis pellentesque nec, ullamcorper eu odio.
- There were sharp gains in bitcoin price above the $8,000 resistance area against the US Dollar.
- The price rallied above the $8,500 and $8,800 resistance levels to move into a positive zone.
- There is a major bullish trend line forming with support near $8,650 on the 4-hours chart of the BTC/USD pair (data feed from Kraken).
- The pair is currently trading above the $9,000 level and it could continue higher towards the $10,000 level.
Bitcoin price is gaining bullish momentum above $9,000 against the US Dollar. BTC is likely to accelerate higher and it could even break the $10,000 level in the near term.
Bitcoin Price Weekly Analysis (BTC)
This past week, bitcoin price found a strong support near the $7,500 level against the US Dollar. As a result, the BTC/USD pair started a strong upward move above the $8,000 and $8,500 resistance levels. The price even settled above the $8,500 resistance and the 100 simple moving average (4-hours). Moreover, there was a clear break above the $8,800 resistance area.
Finally, the price spiked above the $9,000 level and it is currently trading with a strong bullish bias. On the downside, an initial support is near the $9,000 level. The next support is near the $8,800 and $8,780 levels. It represents the 23.6% Fib retracement level of the last wave from the $8,020 low to $9,027 high. Moreover, there is a major bullish trend line forming with support near $8,650 on the 4-hours chart of the BTC/USD pair.
If there is a downside break below the trend line, the price could test $8,500. The 50% Fib retracement level of the last wave from the $8,020 low to $9,027 high is also near the $8,520 level. On the upside, an immediate resistance is near the $9,080 and $9,100 levels. If there is an upside break above $9,100, the price could surge further higher in the coming sessions.
The next target for the bulls could be near the $9,500 level. However, there are high chances of more gains and the price might even rally towards the $10,000 level in the near term.
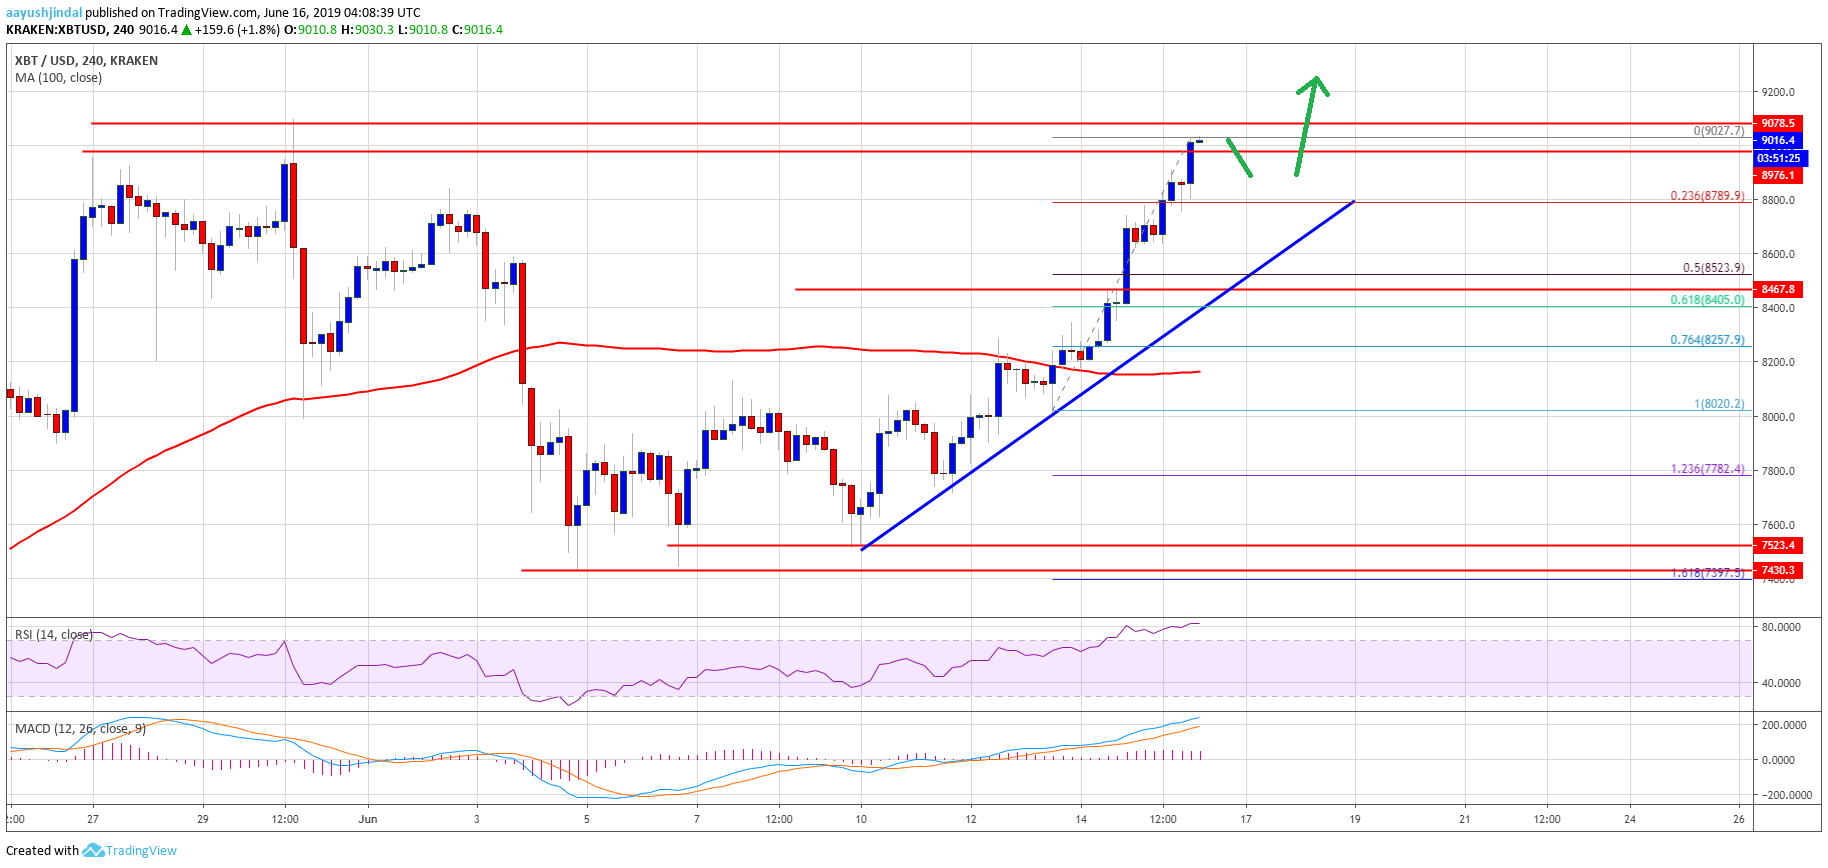
Looking at the chart, bitcoin price seems to be trading with a strong bullish momentum above $8,500 and $8,800. Therefore, there are high chances of more upsides above the $9,100 and $9,500 levels. On the downside, the $8,800 and $8,500 levels are likely to act as major supports for the bulls.
Technical indicators
4 hours MACD – The MACD for BTC/USD is gaining momentum in the bullish zone.
4 hours RSI (Relative Strength Index) – The RSI for BTC/USD is currently in the overbought zone, with no bearish sign.
Major Support Level – $8,500
Major Resistance Level – $9,500