
Reason to trust
How Our News is Made
Strict editorial policy that focuses on accuracy, relevance, and impartiality
Ad discliamer
Morbi pretium leo et nisl aliquam mollis. Quisque arcu lorem, ultricies quis pellentesque nec, ullamcorper eu odio.
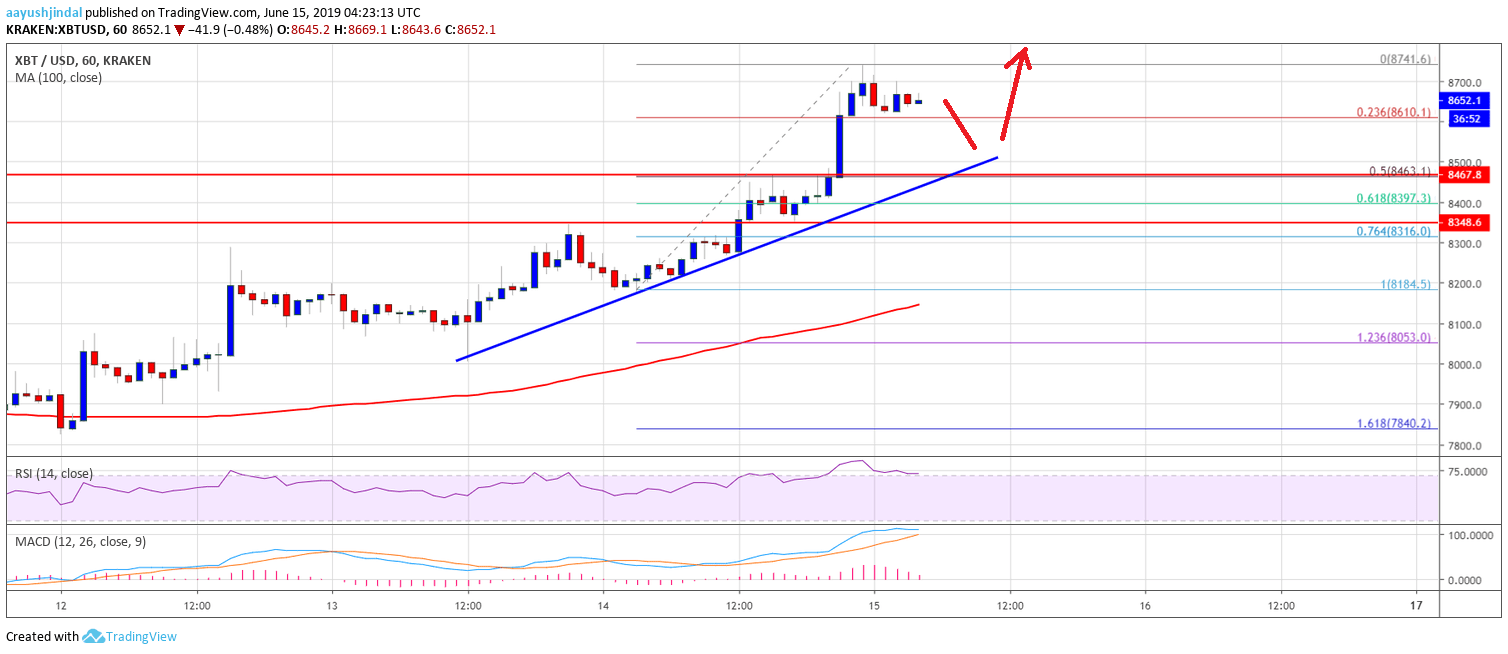
- Bitcoin price is n a positive zone and recently climbed above the $8,500 level against the US Dollar.
- The price is gaining momentum and it seems like it could even trade towards the $8,800 level.
- There is a major bullish trend line forming with support near $8,500 on the hourly chart of the BTC/USD pair (data feed from Kraken).
- The pair might dip a few points, but it remains well bid above the $8,460 pivot level.
Bitcoin price extended gains above the $8,500 resistance against the US Dollar. BTC is showing a lot of bullish signs and it could make an attempt to surpass $8,800 in the near term.
Bitcoin Price Analysis
Yesterday, we discussed the possibility of bitcoin price hitting the $8,500 mark against the US Dollar. The BTC/USD pair did gain momentum above the $8,300 resistance and settled above the 100 hourly simple moving average. It opened the doors for more gains and the price rallied above the $8,400 and $8,500 resistance levels. Additionally, the upward move was strong as the price even broke the $8,600 level.
There was a spike above the $8,700 level and the price traded to a new monthly high at $8,741. It is currently correcting lower below $8,700. Moreover, it is testing the 23.6% Fib retracement level of the recent rally from the $8,184 low to $8,741 high. On the downside, there are many supports near the $8,600 and $8,700 levels.
Furthermore, there is a major bullish trend line forming with support near $8,500 on the hourly chart of the BTC/USD pair. The main support is near the $8,460 level. It coincides with the 50% Fib retracement level of the recent rally from the $8,184 low to $8,741 high. Therefore, if there is a downside break below $8,460, the price could retest the $8,300 support area.
On the upside, an initial resistance is near the $8,740 and $8,750 levels. If there is an upside break above $8,750, the price is likely to surge above the $8,800 resistance area. The next key resistance is near the $9,000 level.
Looking at the chart, bitcoin price is clearly gaining bullish momentum above the $8,500 level. Therefore, there are chances of more upsides above the $8,750 and $8,800 levels. In the short term, there could be a downside correction, but the $8,460 level might provide support. The main uptrend support is now near the $8,300 level in the near term.
Technical indicators:
Hourly MACD – The MACD is currently reducing its bullish slope, with a few negative signs.
Hourly RSI (Relative Strength Index) – The RSI for BTC/USD is currently correcting from the overbought zone.
Major Support Levels – $8,500 followed by $8,460.
Major Resistance Levels – $8,750, $8,800 and $9,000.


