
Reason to trust
How Our News is Made
Strict editorial policy that focuses on accuracy, relevance, and impartiality
Ad discliamer
Morbi pretium leo et nisl aliquam mollis. Quisque arcu lorem, ultricies quis pellentesque nec, ullamcorper eu odio.
- Bitcoin price extended gains recently and broke the $8,100 and $8,200 resistances against the US Dollar.
- The price seems to be setting up for more gains above the $8,300 resistance area.
- There is a crucial bullish trend line forming with support near $8,140 on the hourly chart of the BTC/USD pair (data feed from Kraken).
- The pair is placed nicely above the $8,100 pivot level and it seems like there could be more upsides.
Bitcoin price traded to a new weekly high above $8,300 against the US Dollar. BTC is showing a lot of positive signs and it could even rally towards the $8,500 resistance area.
Bitcoin Price Analysis
In the past few sessions, there was a steady rise in bitcoin price above the $8,000 barrier against the US Dollar. The BTC/USD pair gained bullish momentum above $8,150 and even broke the $8,200 level. Recently, the price broke the last swing high and traded above the $8,300 level. A new weekly high was formed at $8,344 before the price started a downside correction.
Still, the price is trading well above the $8,000 level and the 100 hourly simple moving average. It corrected below the $8,250 level and the 23.6% Fib retracement level of the recent leg from the $8,006 low to $8,344 high. However, the recent decline is finding bids near the $8,175 level. It represents the 50% Fib retracement level of the recent leg from the $8,006 low to $8,344 high.
On the downside, there are many supports near the $8,175 and $8,150 levels. Moreover, there is a crucial bullish trend line forming with support near $8,140 on the hourly chart of the BTC/USD pair. The trend line support coincides with the 61.8% Fib retracement level of the recent leg from the $8,006 low to $8,344 high.
Therefore, as long as the price is above the $8,140 level, it is likely to continue higher. On the upside, an initial resistance is near the $8,300 level, followed by the $8,344 high. If there is an upside break above $8,344, the price is likely to climb higher towards the $8,500 resistance area.
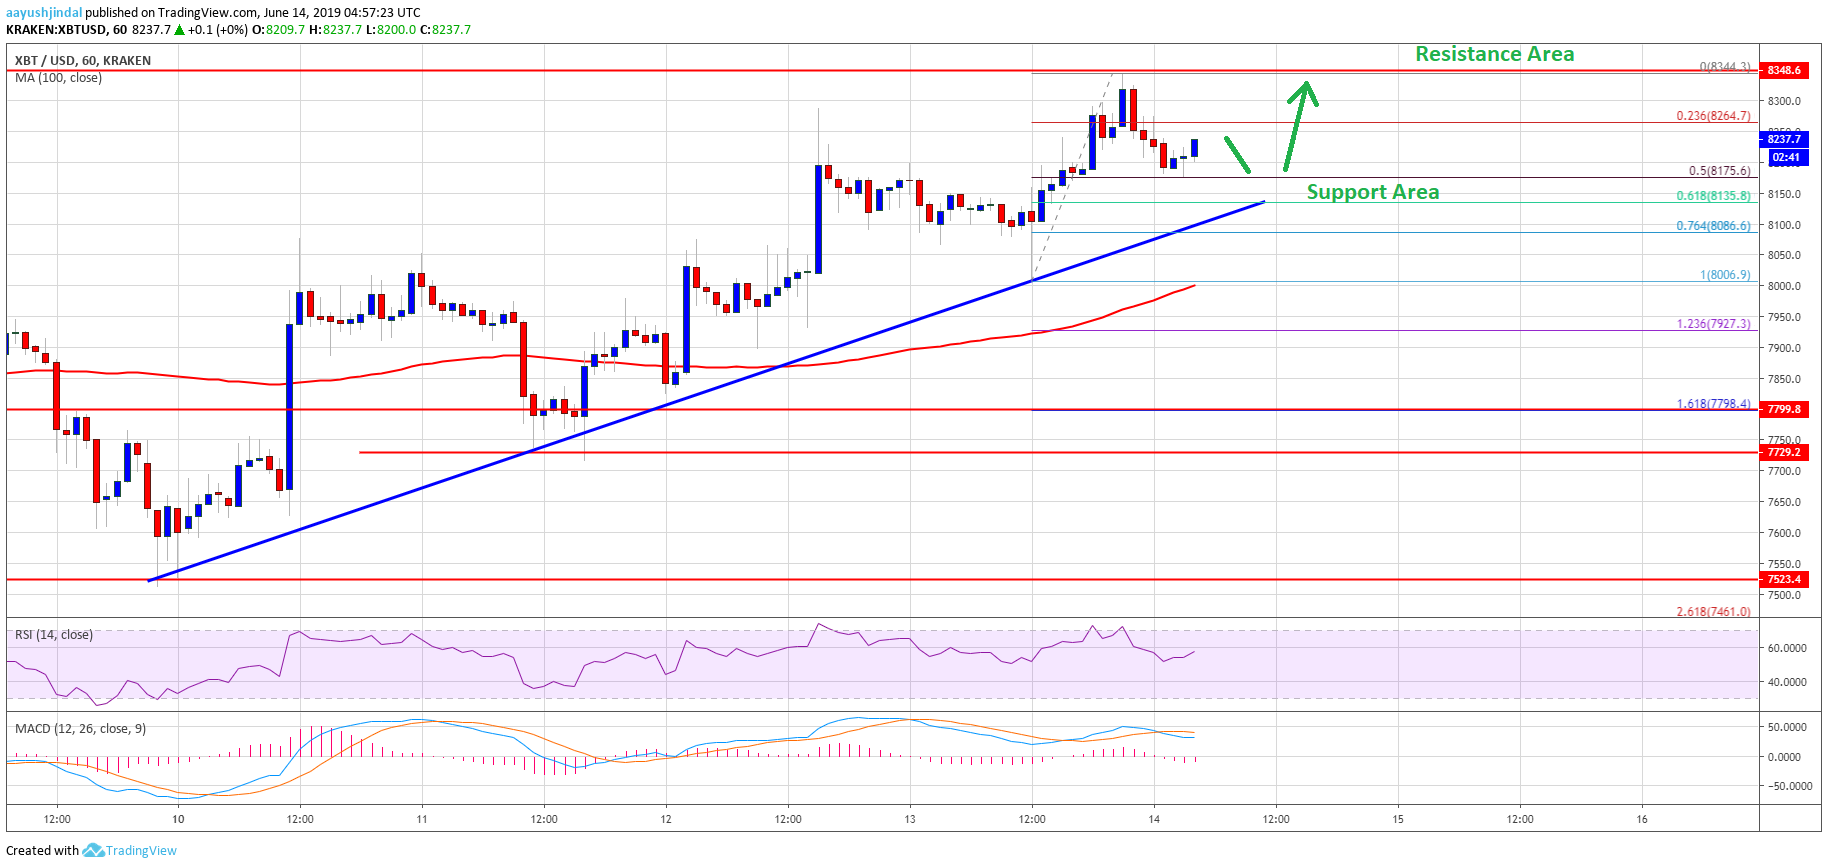
Looking at the chart, bitcoin price is clearly trading in a positive zone above the $8,150 and $8,100 support levels. The main support is near $8,000, below which the price may perhaps move into a bearish zone. The current price action is positive, suggesting an upside break above the $8,300 and $8,350 levels in the near term.
Technical indicators:
Hourly MACD – The MACD is about to move back in the bullish zone.
Hourly RSI (Relative Strength Index) – The RSI for BTC/USD is currently moving higher towards 60 and 65.
Major Support Levels – $8,150 followed by $8,100.
Major Resistance Levels – $8,300, $8,350 and $8,500.


