
Reason to trust
How Our News is Made
Strict editorial policy that focuses on accuracy, relevance, and impartiality
Ad discliamer
Morbi pretium leo et nisl aliquam mollis. Quisque arcu lorem, ultricies quis pellentesque nec, ullamcorper eu odio.
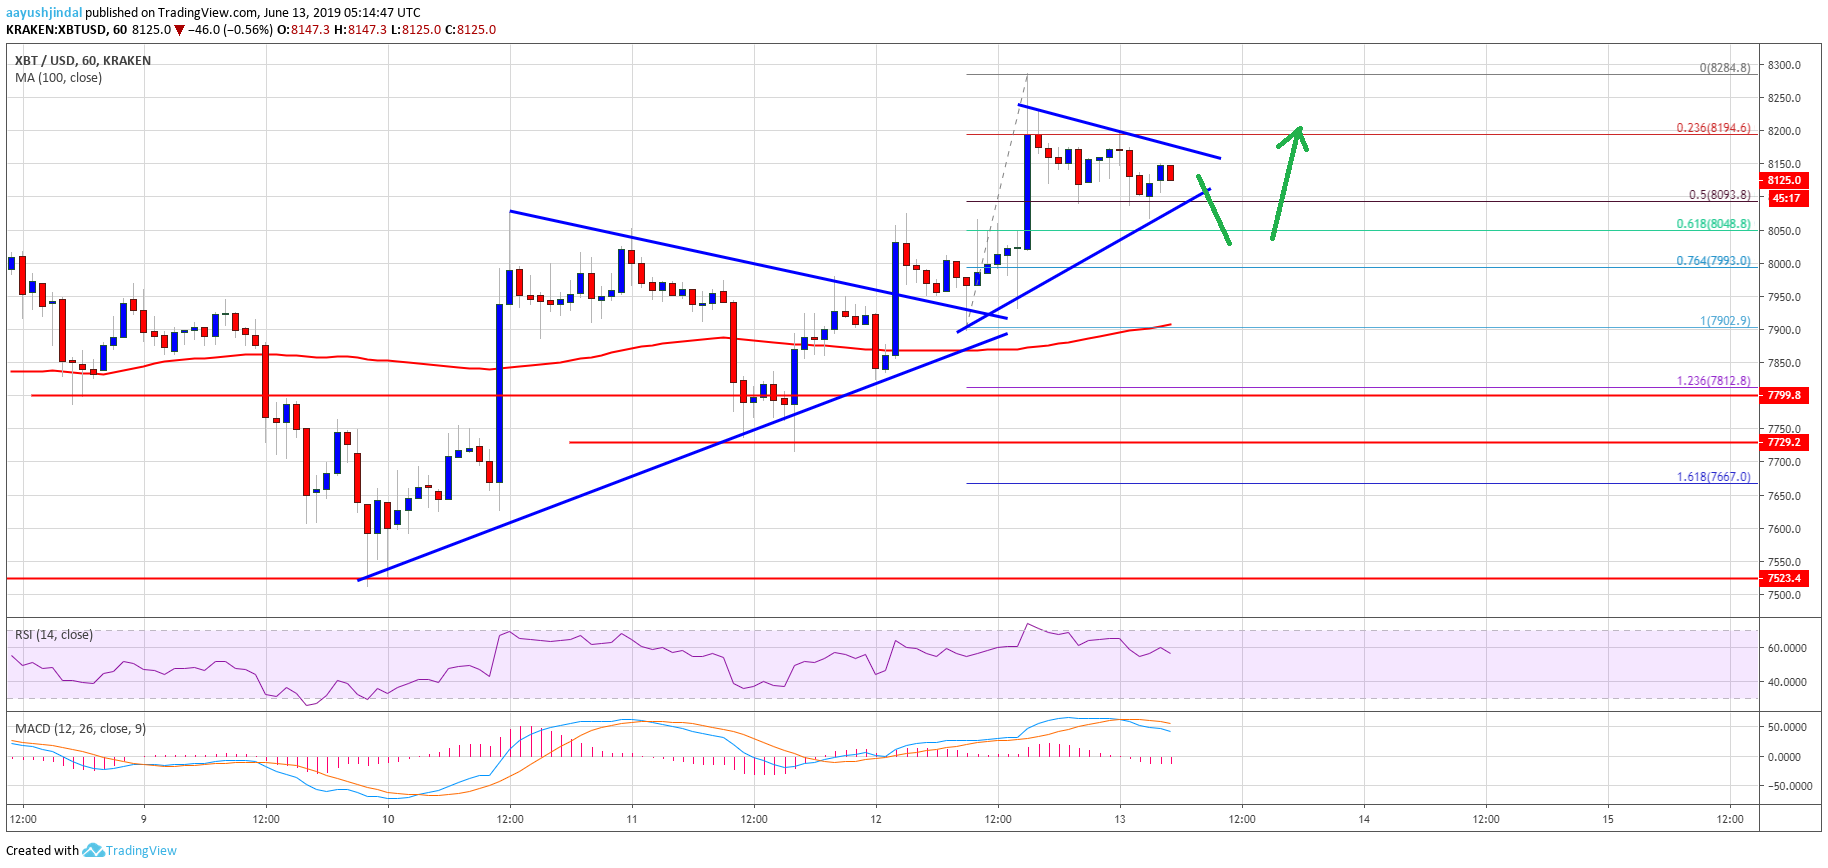
- Bitcoin price broke to the upside and cleared the $7,950 and $8,000 barriers against the US Dollar.
- The price even broke the $8,200 resistance area and it is currently correcting lower.
- There is another major breakout pattern forming with resistance near $8,200 on the hourly chart of the BTC/USD pair (data feed from Kraken).
- The pair is currently trading with a positive bias above the $8,100 and $8,000 support levels.
Bitcoin price started a strong rise after it broke the $8,000 barrier against the US Dollar. BTC is back in a positive zone and it might continue to rise towards the $8,400 level.
Bitcoin Price Analysis
Recently, bitcoin price formed a support base above the $7,700 level against the US Dollar. The BTC/USD pair started a steady rise and broke the $7,800 and $7,850 resistance levels. As a result, the bulls gained strength above the $7,900 level and the 100 hourly simple moving average. It opened the doors for more gains above the main $7,950 and $8,000 resistance levels.
The price even surpassed yesterday’s breakout pattern with resistance near $7,950 on the hourly chart. The bulls managed to push the price to a new weekly high above the $8,100 level. Finally, there was a break above the $8,200 level and a new swing high was formed near $8,284.
Recently, bitcoin price started a downside correction below $8,200. It broke the 23.6% Fib retracement level of the recent wave from the $7,902 swing low to $8,284 high. On the downside, there are many supports near the $8,100 and $8,080 levels. Moreover, there is another major breakout pattern forming with resistance near $8,200 on the hourly chart of the BTC/USD pair.
The 50% Fib retracement level of the recent wave from the $7,902 swing low to $8,284 high is also near the $8,090 level to act as a support. It seems like there could be a downside spike towards the $8,080 or $8,050 support levels before the price starts a fresh increase. On the upside, a break above the $8,200 level could open the doors for more gains in the near term.
Looking at the chart, bitcoin price is showing positive signs above the $8,000 and $8,100 support levels. In the short term, there could be a few swing moves, but the price is likely to hold the $8,000 support. As long as BTC is above $8,000, it could continue to grind higher.
Technical indicators:
Hourly MACD – The MACD is slowly moving in the bearish zone.
Hourly RSI (Relative Strength Index) – The RSI for BTC/USD is currently above the 50 level and is correcting lower.
Major Support Levels – $8,100 followed by $8,000.
Major Resistance Levels – $8,200, $8,300 and $8,380.


