Reason to trust

How Our News is Made
Strict editorial policy that focuses on accuracy, relevance, and impartiality
Ad discliamer
Morbi pretium leo et nisl aliquam mollis. Quisque arcu lorem, ultricies quis pellentesque nec, ullamcorper eu odio.
- LTC surges, adds 19.6 percent
- Halving is catalyzing demand
Up five-fold, LTC’s performance is sublime. Ahead of its block reward halving, demand is slated to increase, potentially being a catalyst to drive prices higher. At the time of writing, LTC is up a staggering 19.6 percent from last week’s close.
Litecoin Price Analysis
Fundamentals
A recent poll revealed that the best way of accumulating Bitcoin (BTC) is through altcoins. That is, savvy traders can buy altcoins for cheap and sell high before liquidating for BTC. Behind this view is a notion that altcoins like Litecoin, are volatile. That is debatable. But to a degree, it is a true sentiment.
Bitcoin, whose volatility has been on a decline in recent days and weeks, is drastically different than altcoins, in that they swing in large margins in short bursts. Presently, that is what traders are observing with Litecoin and Bitcoin Cash.
Litecoin’s rally is because of bullish on-chain events including prospects of confidential transactions and halving. The crypto community is ecstatic about August’s halving. Convinced that the resulting scarcity and supply-demand dynamics will give LTC a higher ‘fair valuation’. And as a result, Litecoin’s market cap is growing.
Commenting on this observation, DiPasquale, a technical analyst said:
“With LTC trading around $125, we can expect a steady rise towards $150 with some normal pullbacks along the way, provided Bitcoin remains between the $7,600 – $8,000 range at the very least.”
Candlestick Arrangement

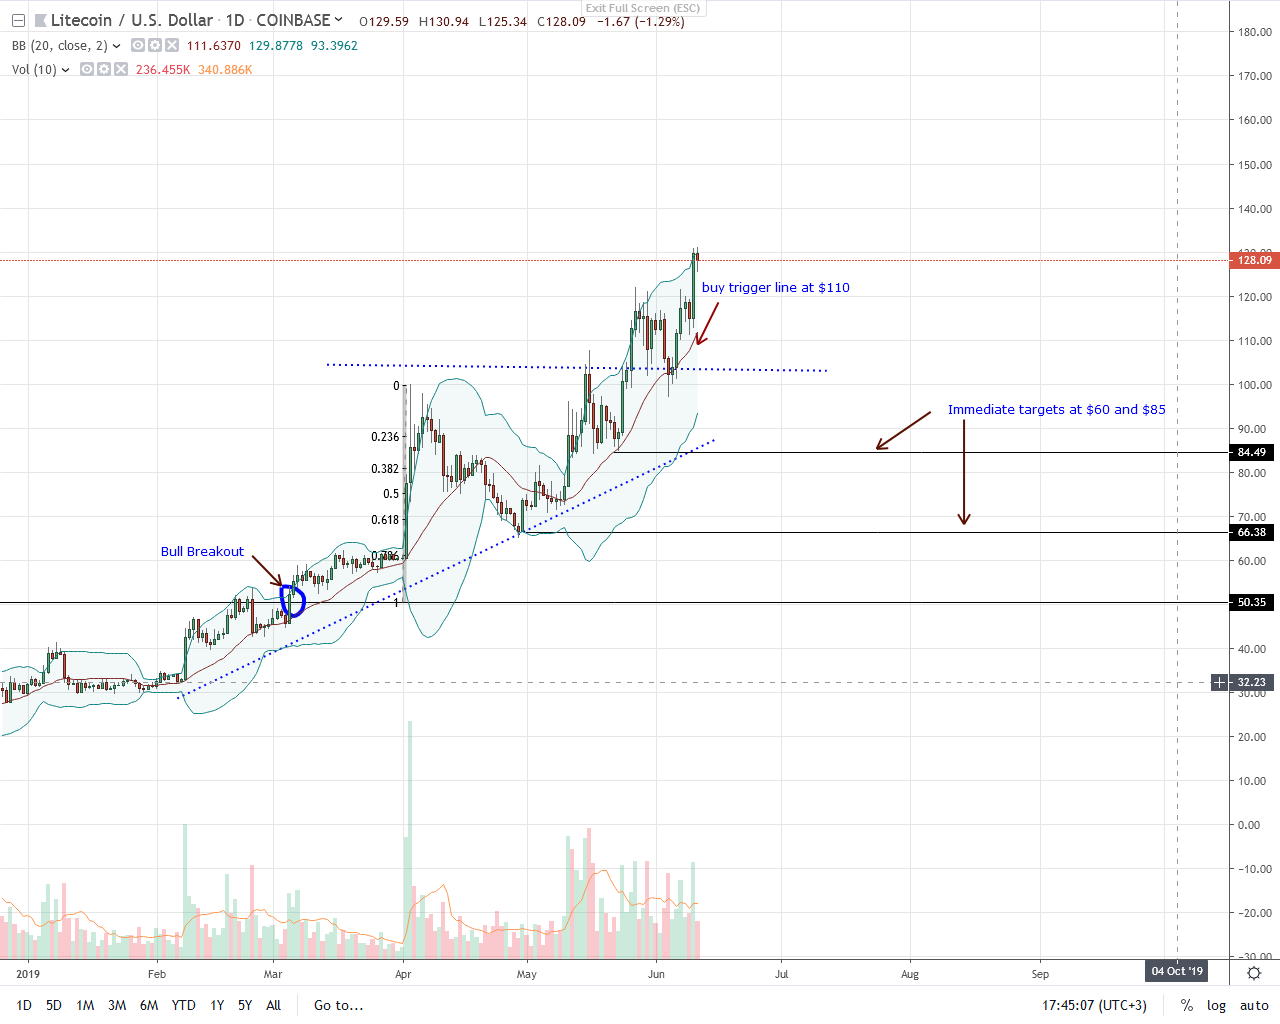
Currently, Litecoin is up 19.6 percent from last week’s close thanks to yesterday’s eruption. Trading above $120, LTC bulls are unwavering, and clearly in control. Because of this break and close above $120, traders can search for opportunities in smaller time frames. It is easy to see why.
First of all, note that LTC is trading within a bullish breakout pattern against the USD. Thanks to May’s demand, the spike above April’s high at $90 did erase losses of Q4 2018 setting in motion the next wave of higher highs.
Secondly, last week’s losses did complete the retest as sellers failed to crash below the $100 mark. From previous mentions, any meltdown driving LTC below $80 could spur a selloff in a retest of $60 before a remarkable recovery.
Because bears floundered, the underlying buy momentum could easily drive prices to $150 or higher in days ahead.
Technical Indicators
Since the trend is up, June 10th candlestick anchors this trade plan. Although trading volumes are lower than those of May 30th at 596k versus 601k, participation is above average.
For uptrend maintenance, accompanying trading volumes must keep rising as demand ahead of halving increase.
Chart courtesy of Trading View. Image Courtesy of Shutterstock


