- Ripple price extended its decline below the $0.4000 support area against the US dollar.
- The price even broke the $0.3800 support area and traded close to the $0.3660 level.
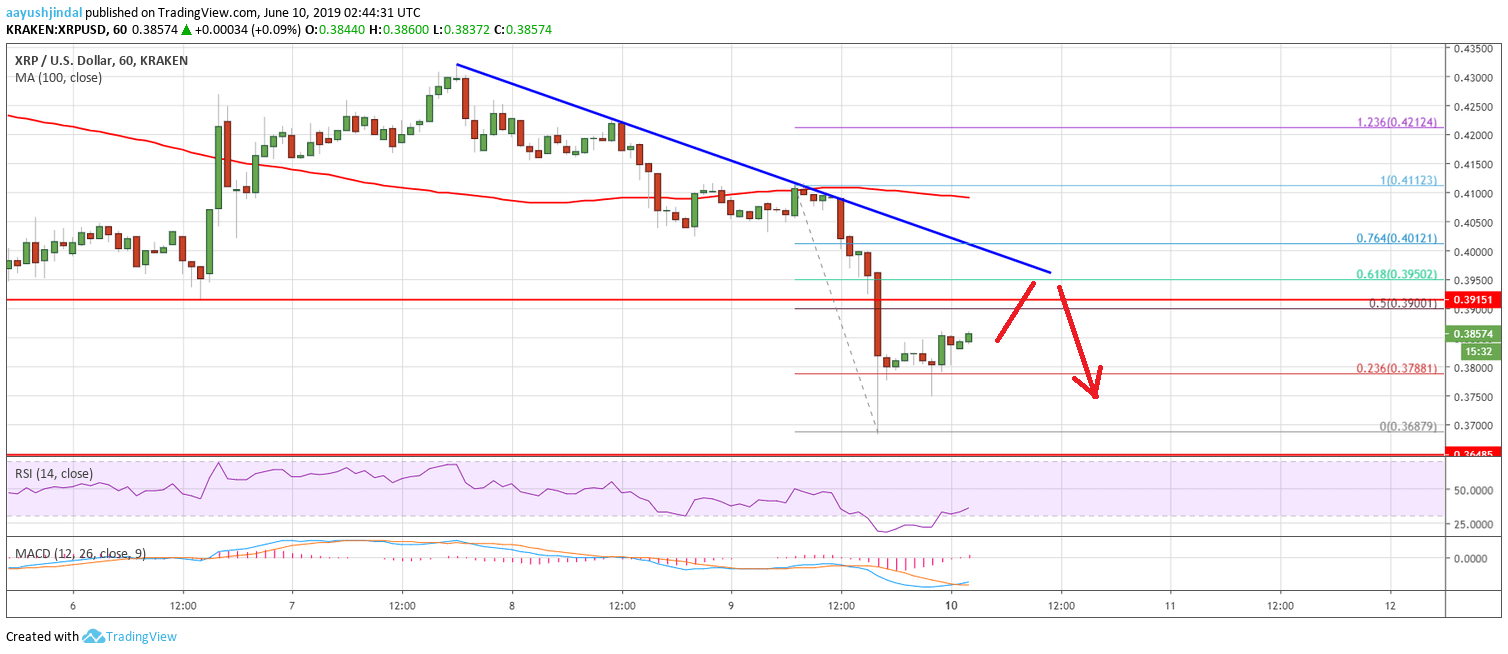
- There is a major bearish trend line forming with resistance near $0.3950 on the hourly chart of the XRP/USD pair (data source from Kraken).
- The pair is likely to struggle near $0.3950 or $0.4000 if it corrects higher from the current levels.
Ripple price is slowly recovering from lows against the US Dollar, similar to bitcoin. XRP might correct higher, but it won’t be easy for the bulls to clear the $0.3950 or $0.4000 level.
Ripple Price Analysis
There was a sharp decline from the $0.4110 swing high in ripple price against the US Dollar. The XRP/USD pair broke the key $0.4000 and $0.3950 support levels to move further into a bearish zone. There was also a close below $0.4000 and the 100 hourly simple moving average. Finally, there was a break below $0.3800 and the price traded close to the $0.3660 level. A swing low was formed at $0.3687 and the price is currently correcting higher.
It is recovering above the $0.3800 level and the 23.6% Fib retracement level of the recent drop from the $0.4112 high to $0.3687 low. On the upside, there are many hurdles near the $0.3950 and $0.4000 levels. An initial resistance is near $0.3900. It coincides with the 50% Fib retracement level of the recent drop from the $0.4112 high to $0.3687 low. There is also a major bearish trend line forming with resistance near $0.3950 on the hourly chart of the XRP/USD pair.
The 61.8% Fib retracement level of the recent drop from the $0.4112 high to $0.3687 low is near the $0.3950 to stop the current wave. To start a decent and strong recovery, the price must clear the $0.3950 and $0.4000 resistance levels. The next key resistance is near the $0.4110 level, above which the price might move back in a positive zone. On the downside, an initial support is near the $0.3800 level, below which the price might move back towards $0.3660. Any further losses could push the price towards the $0.3500 level.
Looking at the chart, ripple price is currently recovering, but it could face a strong resistance near the $0.3950 and $0.4000 levels. If there is a clear break, the price could start a rise towards the $0.4200 level.
Technical Indicators
Hourly MACD – The MACD for XRP/USD is slowly moving back in the bullish zone.
Hourly RSI (Relative Strength Index) – The RSI for XRP/USD is now moving higher and it is currently above the 25 level.
Major Support Levels – $0.3800, $0.3660 and $0.3500.
Major Resistance Levels – $0.3900, $0.3950 and $0.4000.


