
Reason to trust
How Our News is Made
Strict editorial policy that focuses on accuracy, relevance, and impartiality
Ad discliamer
Morbi pretium leo et nisl aliquam mollis. Quisque arcu lorem, ultricies quis pellentesque nec, ullamcorper eu odio.
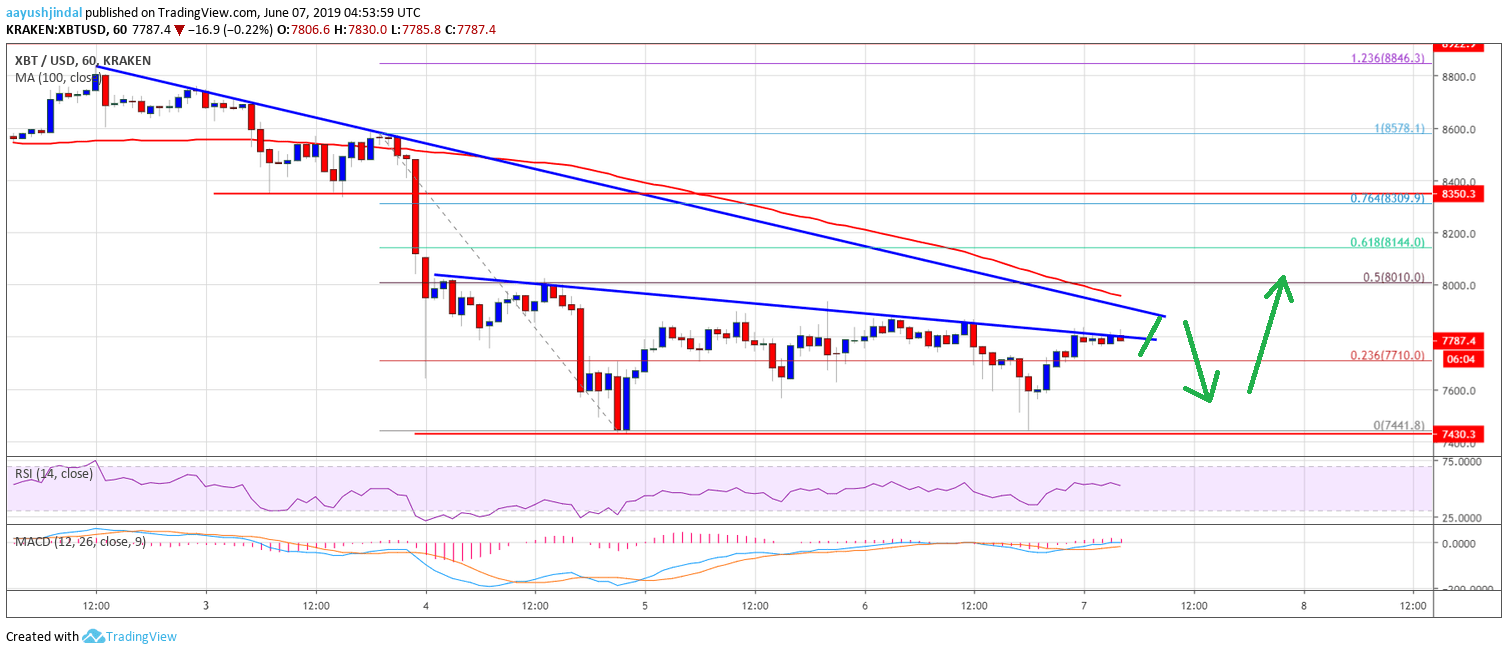
- Bitcoin price seems to be forming a strong support base near $7,440 against the US Dollar.
- The price recovered above $7,700 and it is currently trading near the $7,800 resistance area.
- There is a major bearish trend line forming with resistance near $7,950 on the hourly chart of the BTC/USD pair (data feed from Kraken).
- The pair is likely forming a double bottom pattern and it could stage a decent recovery above $8,000.
Bitcoin price is showing a lot of positive signs above the $7,500 level against the US Dollar. BTC could start a strong recovery once it clears $7,950 and $8,000.
Bitcoin Price Analysis
Recently, bitcoin price retested the last swing low near $7,440 against the US Dollar. The BTC/USD pair remained stable above $7,440 and the bulls defended more losses. A new swing low was formed and the price recently moved higher. There was a break above the $7,500 and $7,600 levels to start an upside correction. The price also climbed above the 23.6% Fib retracement level of the last drop from the $8,578 high to $7,441 low.
At the moment, the price is trading above the $7,700 level and testing a major hurdle near $7,800. There is a connecting bearish trend line forming with resistance near $7,800 on the hourly chart of the BTC/USD pair. Above $7,800, there is another major bearish trend line forming with resistance near $7,950 on the same chart. The 100 hourly simple moving average is also near the trend line and $7,960 to act as a hurdle. The main resistance is near the $8,000 level. The 50% Fib retracement level of the last drop from the $8,578 high to $7,441 low is also near the $8,000 level.
Therefore, a successful break above both trend lines and $8,000 could start a strong upward move. The next key resistance is near the $8,144 level. It represents the 61.8% Fib retracement level of the last drop from the $8,578 high to $7,441 low. On the downside, the price seems to be forming a double bottom pattern near the $7,440 level. A clear break below $7,440 could negate the bullish view and spark more losses.
Looking at the chart, bitcoin price is trading with positive moves above $7,600. Having said that, the bulls need to clear $7,950 and $8,000 to start a strong rally. If they continue to struggle near $8,000, the price might start a fresh decline below $7,500 and $7,440.
Technical indicators:
Hourly MACD – The MACD is currently moving in the bullish zone.
Hourly RSI (Relative Strength Index) – The RSI for BTC/USD is currently positioned well above the 50 level.
Major Support Levels – $7,700 followed by $7,600.
Major Resistance Levels – $7,950, $8,000 and $8,145.


