- BTC down 2.8 percent
- Evening Star pattern prints
Traders are wary, doubting the strength of the underlying momentum. At the time of press, Bitcoin is cooling off, dropping 2.8 percent in 24 hours as prices range below May high.
Bitcoin Price Analysis
Fundamentals
True, May was an exciting month for Bitcoin and indeed crypto traders. After a lackluster performance in Q1 2019, the recovery in April and the assertion of May did bring good tidings to hodlers.
As a result, Bitcoin now has deeper liquidity with prices more than doubling from December’s lows. That’s not forgetting increasing network’s difficulty that often swings dependent on spot rates and investor expectations.
However, it appears as if traders and the general investor community are skeptical of buy momentum. The failure of bulls to reassert themselves over the weekend seems to be the reason for caution. The result of this floundering is a consolidation that is withdrawing liquidity from the market.
Add that to the formation of the “Evening Star” candlestick pattern and traders are increasingly dismissive of bulls. Taking to Twitter, a trader, ‘Bleeding Crypto’ said:
“I don’t remember when I saw that much heat under the Price Action recently… Bloody Monday might be just around the corner. It’s better to be safe than sorry.”
Candlestick Arrangement

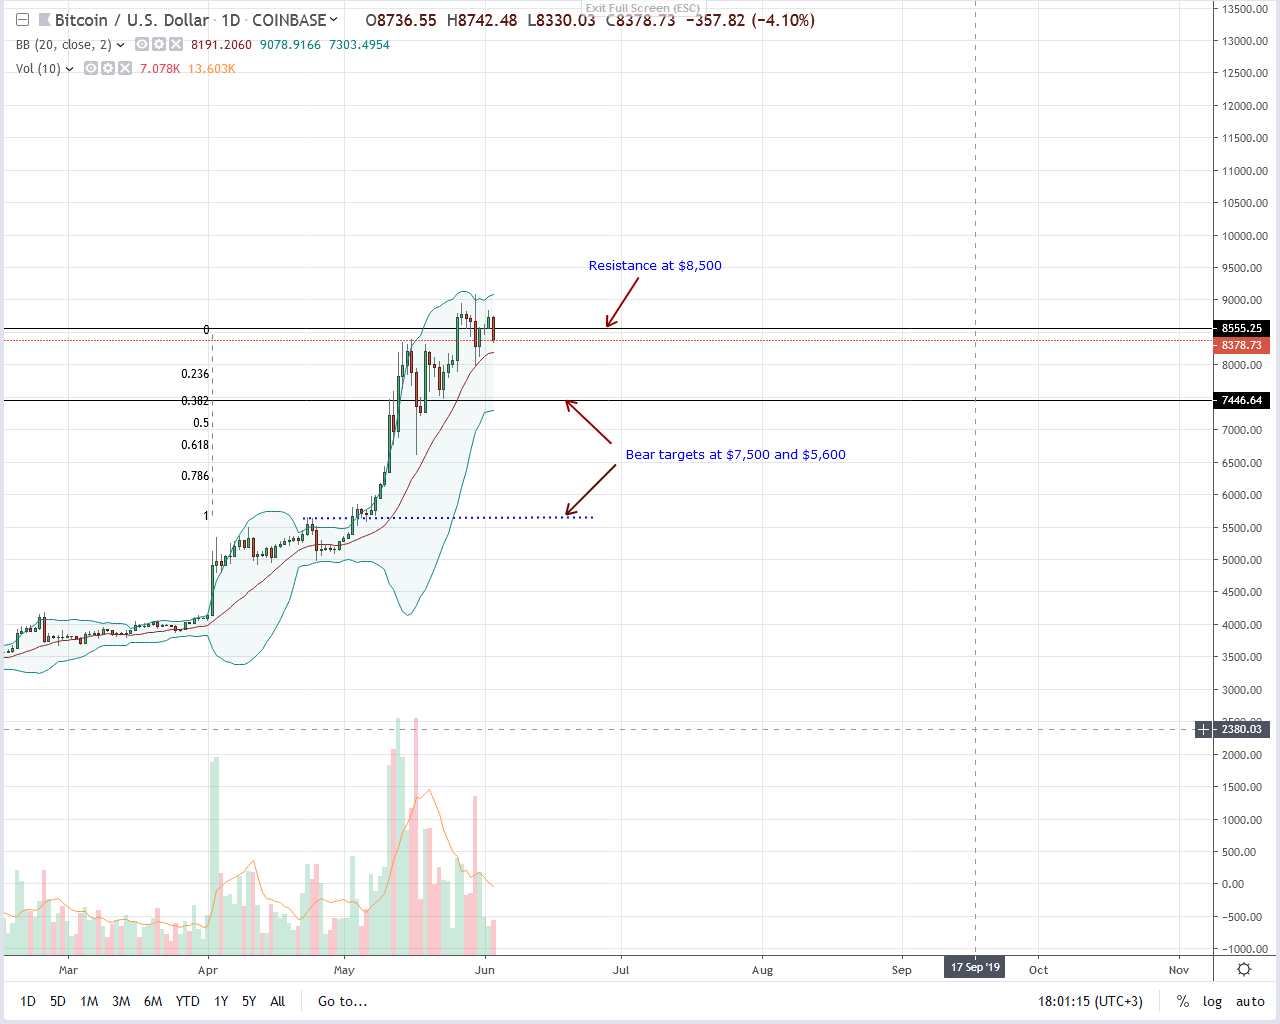
At the time of press, BTC is under pressure, down 2.8 percent from yesterday’s close. All the same, the uptrend is solid and bulls, flimsy but steadfast. Even though we shall maintain an upbeat stance, expecting BTC to inch higher, it is the formation of the Evening Star in the weekly chart that cast doubt on the strength of the underlying momentum.
Note that not only do we have a doji but the deviation from the upper Bollinger Band (BB) hint of slacking buyers. As a result, the best approach is to maintain a neutral stance. If buyers recover with blast above $9,100 or May high, conservative traders can buy the dips with a modest target at $10,000.
Conversely, any drop below May 30th low could trigger a steep selloff that may drive BTC to $7,500, $6,600 and later $5,600 in a retest phase.
Technical Indicators
Anchoring this trade plan is May 30th bar. It is wide-ranging with above-average trading volumes of 31k against 19k of May 26th. BTC is ranging inside this bar.
As mentioned above, any move driving prices above $9,100 or below $7,500 must be with high trading volumes exceeding 31k or 47k of May 13th. That will either confirm buyers or nullify this trade plan.
Chart courtesy of Trading View. Image Courtesy of Shutterstock


