
Reason to trust
How Our News is Made
Strict editorial policy that focuses on accuracy, relevance, and impartiality
Ad discliamer
Morbi pretium leo et nisl aliquam mollis. Quisque arcu lorem, ultricies quis pellentesque nec, ullamcorper eu odio.
- Bitcoin price started a decent upward move above the $8,500 level against the US Dollar.
- The price is trading with a positive tone above $8,600 and the 100 hourly simple moving average.
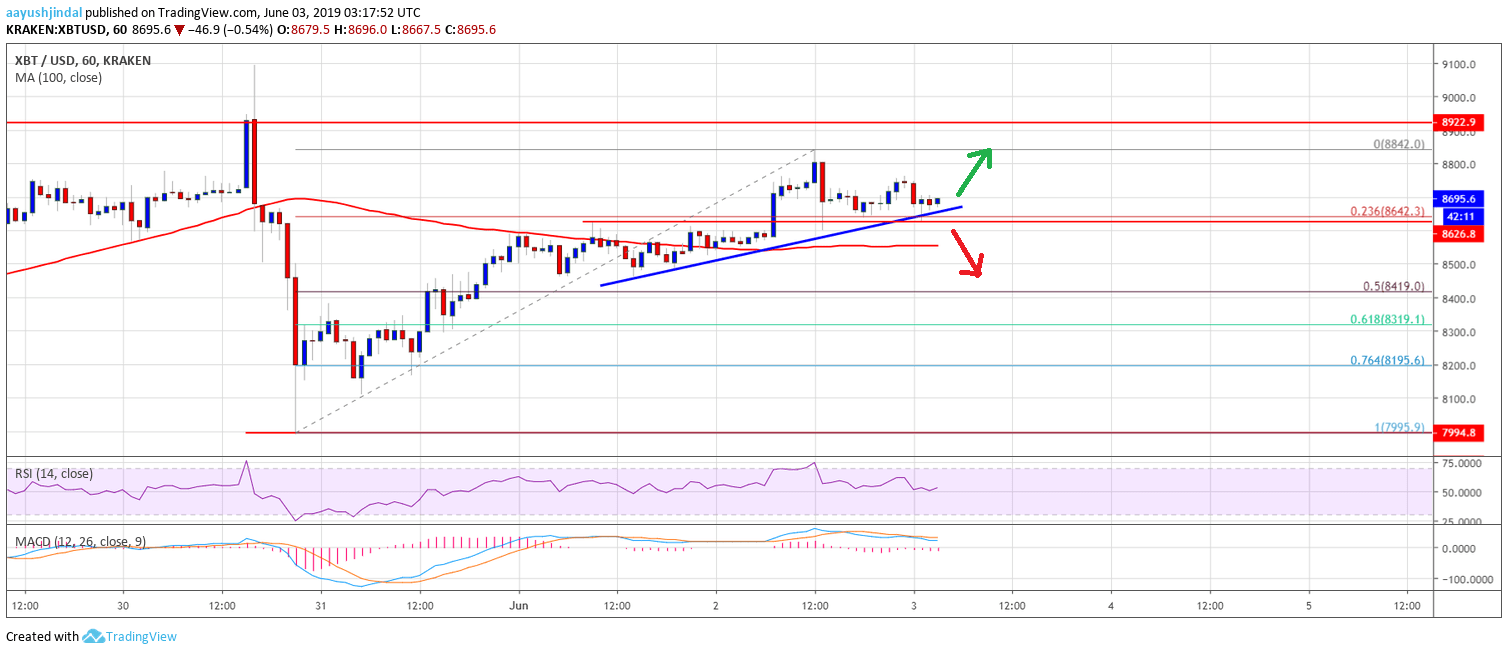
- There is a key bullish trend line forming with support at $8,640 on the hourly chart of the BTC/USD pair (data feed from Kraken).
- The pair is currently consolidating and it could soon climb above the $8,800 resistance.
Bitcoin price is currently trading in a range above $8,600 against the US Dollar. BTC could start a sharp upward move above the $8,800 and $8,850 resistance levels.
Bitcoin Price Analysis
Recently, bitcoin price slowly climbed above the $8,400 and $8,500 levels against the US Dollar. The BTC/USD pair even broke the $8,800 level ad traded as high as $8,842. There was a close above the $8,600 level and the 100 hourly simple moving average. Later, the pair started a downside correction below the $8,800 level. It tested the $8,650 support, where the bulls emerged. Moreover, the 23.6% Fib retracement level of the recent wave from the $7,995 low to $8,842 high is likely to act as a strong support.
On the downside, there is a key bullish trend line forming with support at $8,640 on the hourly chart of the BTC/USD pair. If there is a downside break below the trend line, the price could test the $8,600 support and the 100 hourly simple moving average. The next important support is near the $8,500 level. If there are more losses, the price could test the $8,400 support area. It coincides with the 50% Fib retracement level of the recent wave from the $7,995 low to $8,842 high.
On the upside, an initial resistance is near the $8,800 level. If there is an upside break above the $8,800 barrier, the price could accelerate above the $8,850 level. The next key resistances on the upside are near the $8,900 and $9,000 levels. If there is a break above $9,000, the price is likely to gain pace above $9,100.
Looking at the chart, bitcoin price is currently consolidating gains above the $8,600 level. In the short term, there could be a downside correction below $8,600. However, there are many supports on the downside near the $8,500 and $8,420 levels. A successful close below the $8,400 level is likely to start a solid downward move towards the $8,100 level in the near term.
Technical indicators:
Hourly MACD – The MACD is currently in the bearish zone, with positive signs.
Hourly RSI (Relative Strength Index) – The RSI for BTC/USD is currently above the 50 level, with a positive angle.
Major Support Levels – $8,600 followed by $8,500.
Major Resistance Levels – $8,800, $8,850 and $8,900.


