Reason to trust
How Our News is Made
Strict editorial policy that focuses on accuracy, relevance, and impartiality
Ad discliamer
Morbi pretium leo et nisl aliquam mollis. Quisque arcu lorem, ultricies quis pellentesque nec, ullamcorper eu odio.
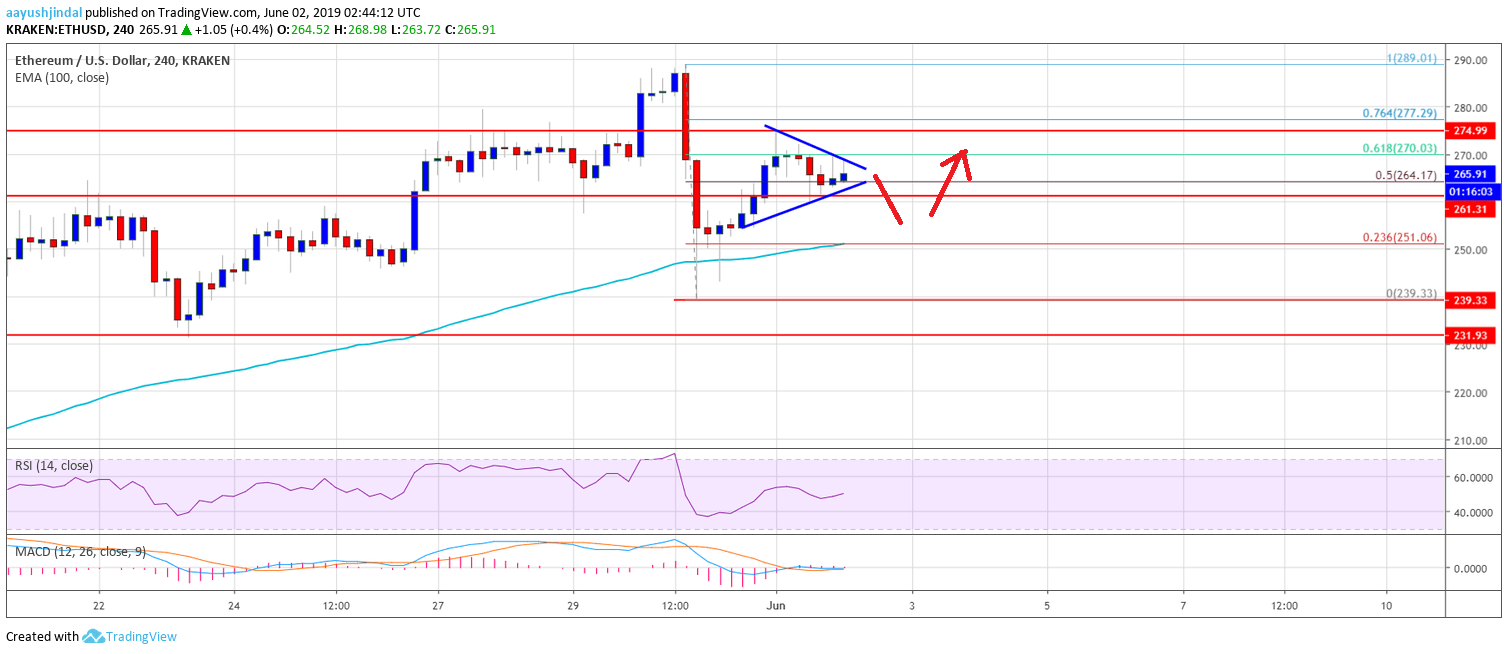
- ETH price recovered nicely after declining towards the $240 support area against the US Dollar.
- The price traded above the $270 level, but it seems to be struggling near $278 and $280.
- There is a short term breakout pattern forming with resistance near $270 on the 4-hours chart of ETH/USD (data feed via Kraken).
- The pair remains well supported on dips as long as there is no close below the $250 support area.
Ethereum price jumped back after correcting sharply versus the US Dollar, similar to bitcoin. ETH must gain momentum above $270 and $280 to continue higher.
Ethereum Price Weekly Analysis
This past week, Ethereum price remained in a positive zone and traded above the $270 level against the US Dollar. The ETH/USD pair even broke the $280 level and settled above the 100 simple moving average (4-hours). The price traded as high as $289.01 before it corrected lower significantly. There was a downside break below the $264 and $250 support levels. The price even tested the $240 support and spiked below the 100 simple moving average (4-hours).
However, there was no close below the 100 simple moving average (4-hours) and the price recovered above the $250 level. There was a break above the $260 level, and the 50% Fib retracement level of the last decline from the $289 swing high to $239 swing low. The bulls managed to push the price above the $270 level, but it seems to be struggling near the $278 and $280 levels. The 76.4% Fib retracement level of the last decline from the $289 swing high to $239 swing low is also acting as a hurdle for the bulls.
At the moment, there is a short term breakout pattern forming with resistance near $270 on the 4-hours chart of ETH/USD. If there is an upside break above the triangle resistance, the price could move above $275. However, the price must gain pace above the $280 level to continue higher. On the downside, if the price breaks the $260 support, it could decline again. The main support is near the $250 level and the 100 SMA. If there is a close below the 100 SMA, the price might decline below $240.
The above chart indicates that Ethereum seems to be consolidating in a tiny range above the $260 support area. To start a fresh increase, the price must break $270 and $280. The next main hurdle for the bulls is near the $300 level.
Technical Indicators
4 hours MACD – The MACD for ETH/USD is slowly moving in the bullish zone.
4 hours RSI – The RSI for ETH/USD is currently just below the 50 level, with a flat structure.
Major Support Level – $250
Major Resistance Level – $280