
Reason to trust
How Our News is Made
Strict editorial policy that focuses on accuracy, relevance, and impartiality
Ad discliamer
Morbi pretium leo et nisl aliquam mollis. Quisque arcu lorem, ultricies quis pellentesque nec, ullamcorper eu odio.
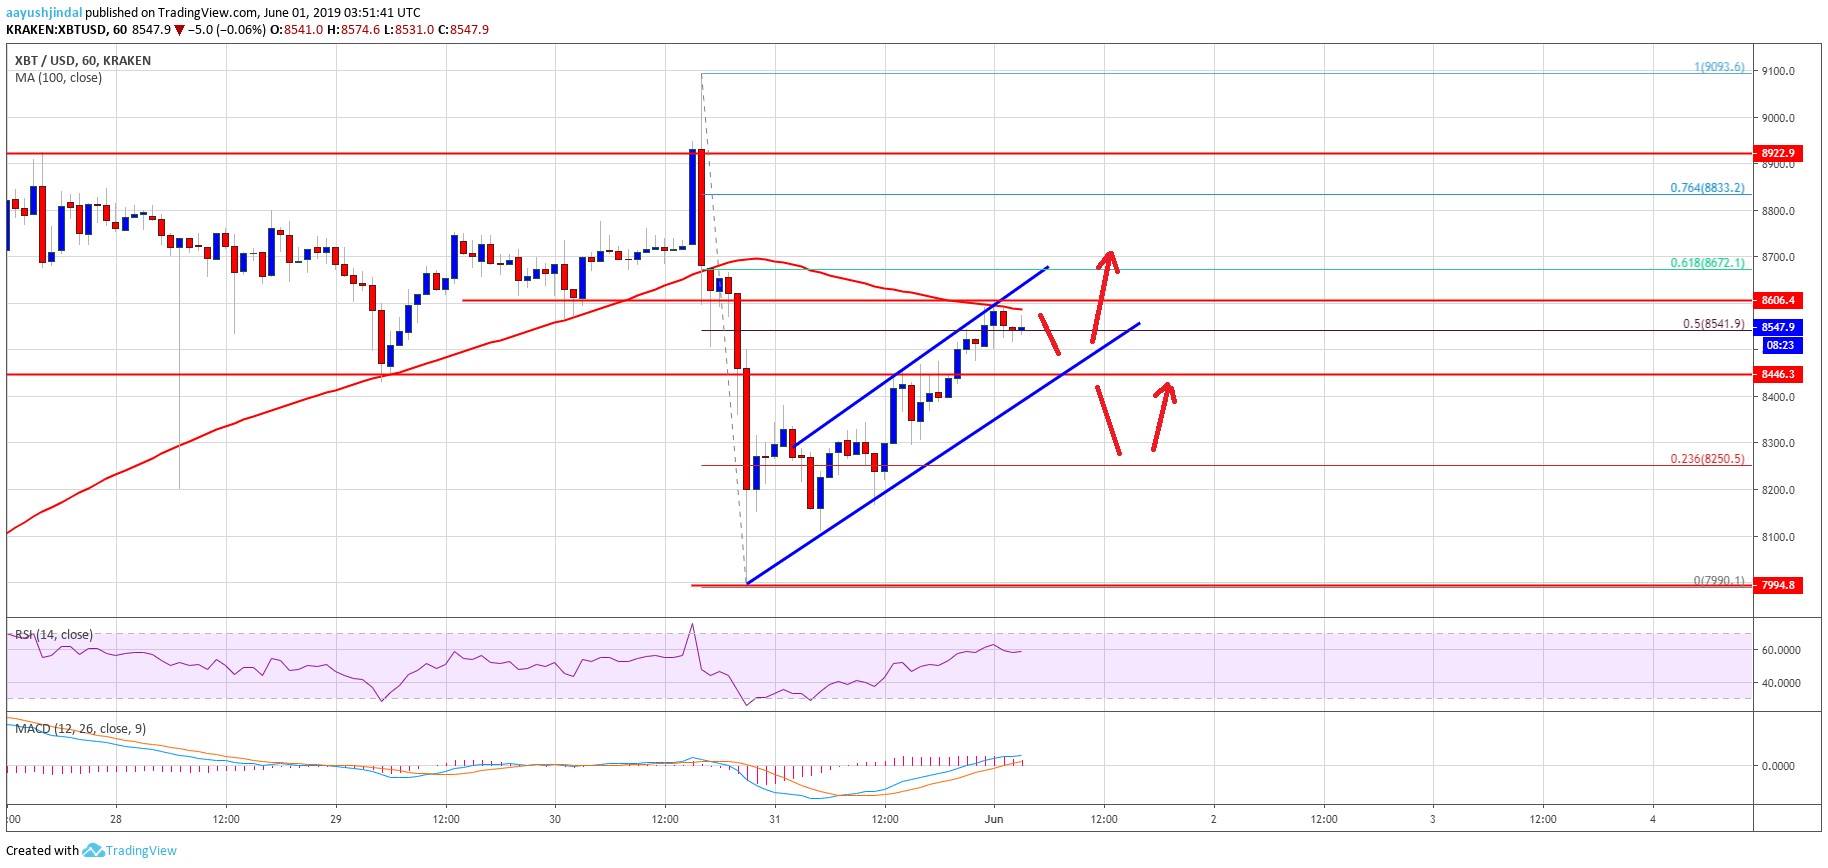
- Bitcoin price declined heavily and tested the $8,000 support area against the US Dollar.
- The price recovered nicely and traded above the $8,300 and $8,450 resistance levels.
- There is a rising channel forming with support near $8,450 on the hourly chart of the BTC/USD pair (data feed from Kraken).
- The pair is facing a solid resistance near the $8,600 area and the 100 hourly simple moving average.
Bitcoin price is currently recovering above $8,450 against the US Dollar. BTC needs to surpass the $8,600 barrier to move back in a positive zone and climb further higher.
Bitcoin Price Analysis
Recently, bitcoin price declined sharply after pumping to a new 2019 high at $9,091 against the US Dollar. The BTC/USD pair collapsed below the $8,800 and $8,600 support levels. The decline was strong and gained pace below the $8,450 support plus the 100 hourly simple moving average. Moreover, there was a clear break below the $8,300 support and the $8,220 pivot level. The price traded close to the $8,000 level, where the bulls protected further losses.
A swing low was formed near $7,999 before the price started a strong recovery. There was a pump above the $8,300 level and the 23.6% Fib retracement level of the recent decline from the $9,091 high to $7,999 low. More importantly, the price traded above the $8,450 resistance. At the moment, the price is trading above the 50% Fib retracement level of the recent decline from the $9,091 high to $7,999 low. Besides, there is a rising channel forming with support near $8,450 on the hourly chart of the BTC/USD pair.
On the downside, there is a strong support forming near the $8,450 level. If there is a downside break below $8,450, the price might restart its decline towards the $8,300 level. The next key supports are near the $8,220 and $8,150 levels. On the upside, the main resistance is near the $8,600 level and the 100 hourly SMA. The 61.8% Fib retracement level of the recent decline from the $9,091 high to $7,999 low is also near the $8,670 level. Therefore, a successful break above the $8,600 and $8,670 levels is needed for more gains in the near term.
Looking at the chart, bitcoin price recovered nicely above $8,450 and it is currently showing positive zone. If the bulls remain in action and push the price above $8,600, there are chances of bullish continuation.
Technical indicators:
Hourly MACD – The MACD is back in the bullish zone, with positive signs.
Hourly RSI (Relative Strength Index) – The RSI for BTC/USD climbed back above the 50 level, with a positive angle.
Major Support Levels – $8,450 followed by $8,300.
Major Resistance Levels – $8,600, $8,670 and $8,800.


