Reason to trust
How Our News is Made
Strict editorial policy that focuses on accuracy, relevance, and impartiality
Ad discliamer
Morbi pretium leo et nisl aliquam mollis. Quisque arcu lorem, ultricies quis pellentesque nec, ullamcorper eu odio.
- Bitcoin price spiked above the $8,950 and $9,000 levels, but failed to hold gains against the US Dollar.
- The price declined heavily and traded below the $8,720 and $8,440 support levels.
- There was a break below a crucial bullish trend line with support at $8,560 on the hourly chart of the BTC/USD pair (data feed from Kraken).
- The pair is currently trading in a bearish zone below the $8,300 level and it could continue lower.
Bitcoin price failed near the $9,000 level and declined sharply against the US Dollar. BTC is currently trading in a bearish zone, with a risk of a drop towards the $7,880 support.
Bitcoin Price Analysis
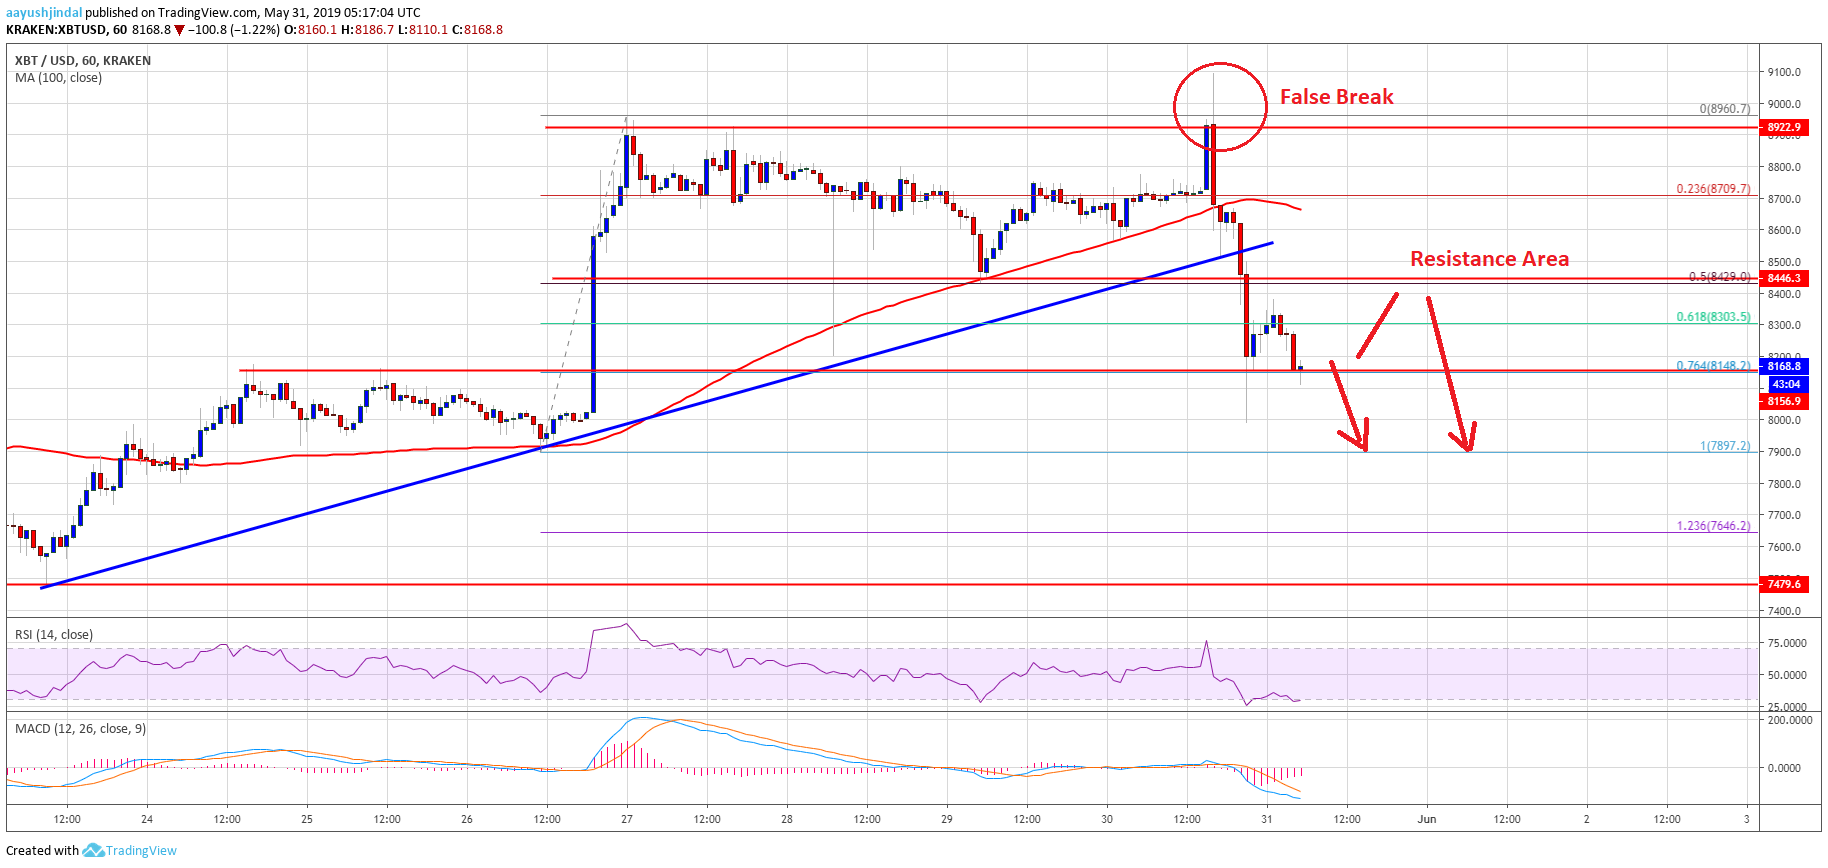
Yesterday, there was an upside extension in bitcoin price above $8,800 against the US Dollar. The BTC/USD pair spiked above the $8,950 and $9,000 levels, but failed to hold gains. As a result, there was a major bearish reaction below the $8,800 level. The price declined heavily below the $8,600 support level and the 100 hourly simple moving average. Moreover, there was a clear break below the 50% Fib retracement level of the upward move from the $7,897 low to $8,960 swing high.
More importantly, there was a break below a crucial bullish trend line with support at $8,560 on the hourly chart of the BTC/USD pair. The pair is currently trading below the $8,200 level and recently tested the 76.4% Fib retracement level of the upward move from the $7,897 low to $8,960 swing high. If there is an upside correction, an initial resistance could be near the $8,400 level. The main resistance might be $8,440, above which the price could revisit the $8,700 level.
On the downside, an immediate support is at $8,000. If there is break below $8,000, the price could retest the $7,880 support area. If there are more losses, the next target for the bulls might be $7,646. It represents the 1.236 Fib extension level of the upward move from the $7,897 low to $8,960 swing high. The current price action is bearish and there is a risk of more losses below $8,000.
Looking at the chart, bitcoin price clearly started a major downside correction below $8,500. There could be range moves in the short term, but the price is likely to extend downsides below $8,100. Once the current correction is complete near $7,880 or $7,646, the price is likely to bounce back.
Technical indicators:
Hourly MACD – The MACD is slowly reducing its bearish slope, with no major positive sign.
Hourly RSI (Relative Strength Index) – The RSI for BTC/USD declined heavily and it is currently flat in the oversold zone.
Major Support Levels – $8,000 followed by $7,880.
Major Resistance Levels – $8,300, $8,440 and $8,500.