
Reason to trust
How Our News is Made
Strict editorial policy that focuses on accuracy, relevance, and impartiality
Ad discliamer
Morbi pretium leo et nisl aliquam mollis. Quisque arcu lorem, ultricies quis pellentesque nec, ullamcorper eu odio.
- Bitcoin price topped near the $8,950 level and recently corrected lower against the US Dollar.
- The price declined below the $8,700 and $8,620 support levels to enter a short term bearish zone.
- There is a major bullish trend line forming with support near $8,300 on the hourly chart of the BTC/USD pair (data feed from Kraken).
- The pair must stay above the $8,300 support area to start a fresh increase in the near term.
Bitcoin price started a downside correction below $8,600 against the US Dollar. BTC is likely to test the 100 hourly SMA or $8,300 before it starts a fresh upward move.
Bitcoin Price Analysis
Recently, we saw a solid rise in bitcoin price towards the $9,000 resistance against the US Dollar. The BTC/USD pair traded close to the $8,960 level and formed a new swing high at $8,952. Later, it started a downside correction below the $8,800 and $8,700 levels. There was a break below the 23.6% Fib retracement level of the upward move from the $7,900 low to $8,952 high. Moreover, there was a break below a key declining channel with support near the $8,600 level on the hourly chart.
It opened the doors for more losses towards the $8,425 support. Moreover, the 100 hourly simple moving average is also near the $8,425 support. Finally, the 50% Fib retracement level of the upward move from the $7,900 low to $8,952 high is near the $8,426 level. More importantly, there is a major bullish trend line forming with support near $8,300 on the hourly chart of the BTC/USD pair. Therefore, there are many supports on the downside near the $8,425 and $8,300 levels.
The main support is near $8,300 and the 61.8% Fib retracement level of the upward move from the $7,900 low to $8,952 high. If there is a close below the $8,300 support, the price might extend its decline below the $8,200 and $8,140 support levels. Conversely, if the $8,300 support holds, the price is likely to start a fresh increase. An initial resistance is near the $8,600 level, above which the price might test the $8,710 channel resistance.
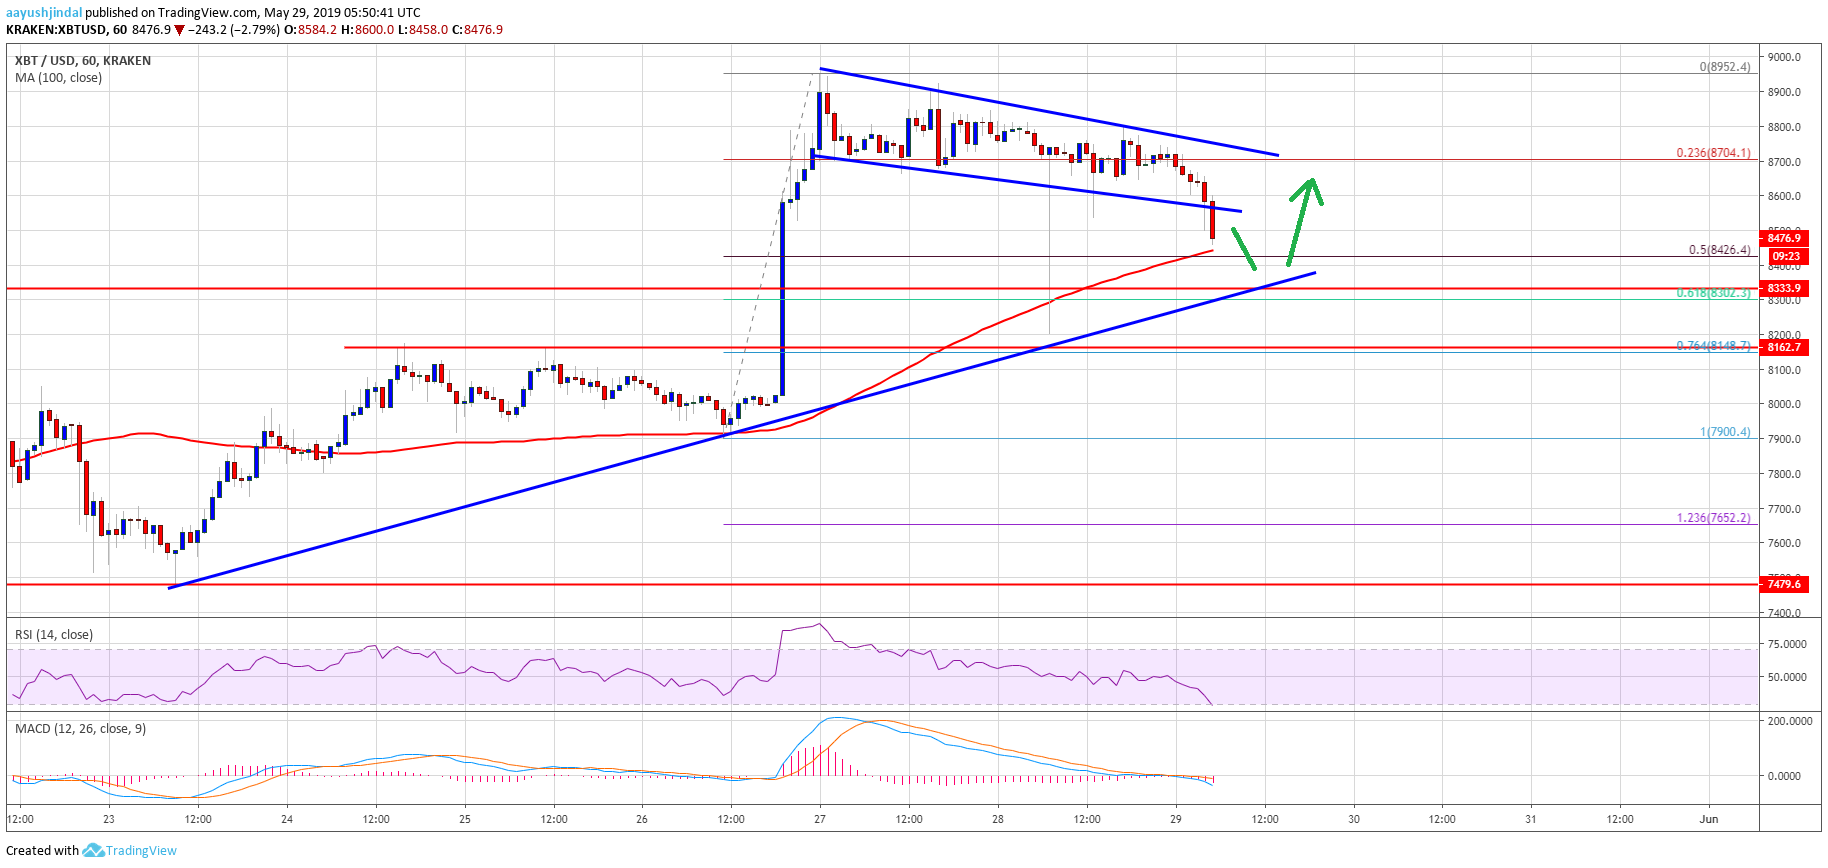
Looking at the chart, bitcoin price is clearly correcting lower below $8,600. However, there are many key buy zones near $8,425 and $8,400. As long as the price is trading above the $8,300 support zone, it is likely to complete correction and increase towards $8,700.
Technical indicators:
Hourly MACD – The MACD is currently gaining strength in the bearish zone.
Hourly RSI (Relative Strength Index) – The RSI for BTC/USD declined recently below the 40 level, with a bearish angle.
Major Support Levels – $8,425 followed by $8,300.
Major Resistance Levels – $8,600, $8,700 and $8,850.