
Reason to trust
How Our News is Made
Strict editorial policy that focuses on accuracy, relevance, and impartiality
Ad discliamer
Morbi pretium leo et nisl aliquam mollis. Quisque arcu lorem, ultricies quis pellentesque nec, ullamcorper eu odio.
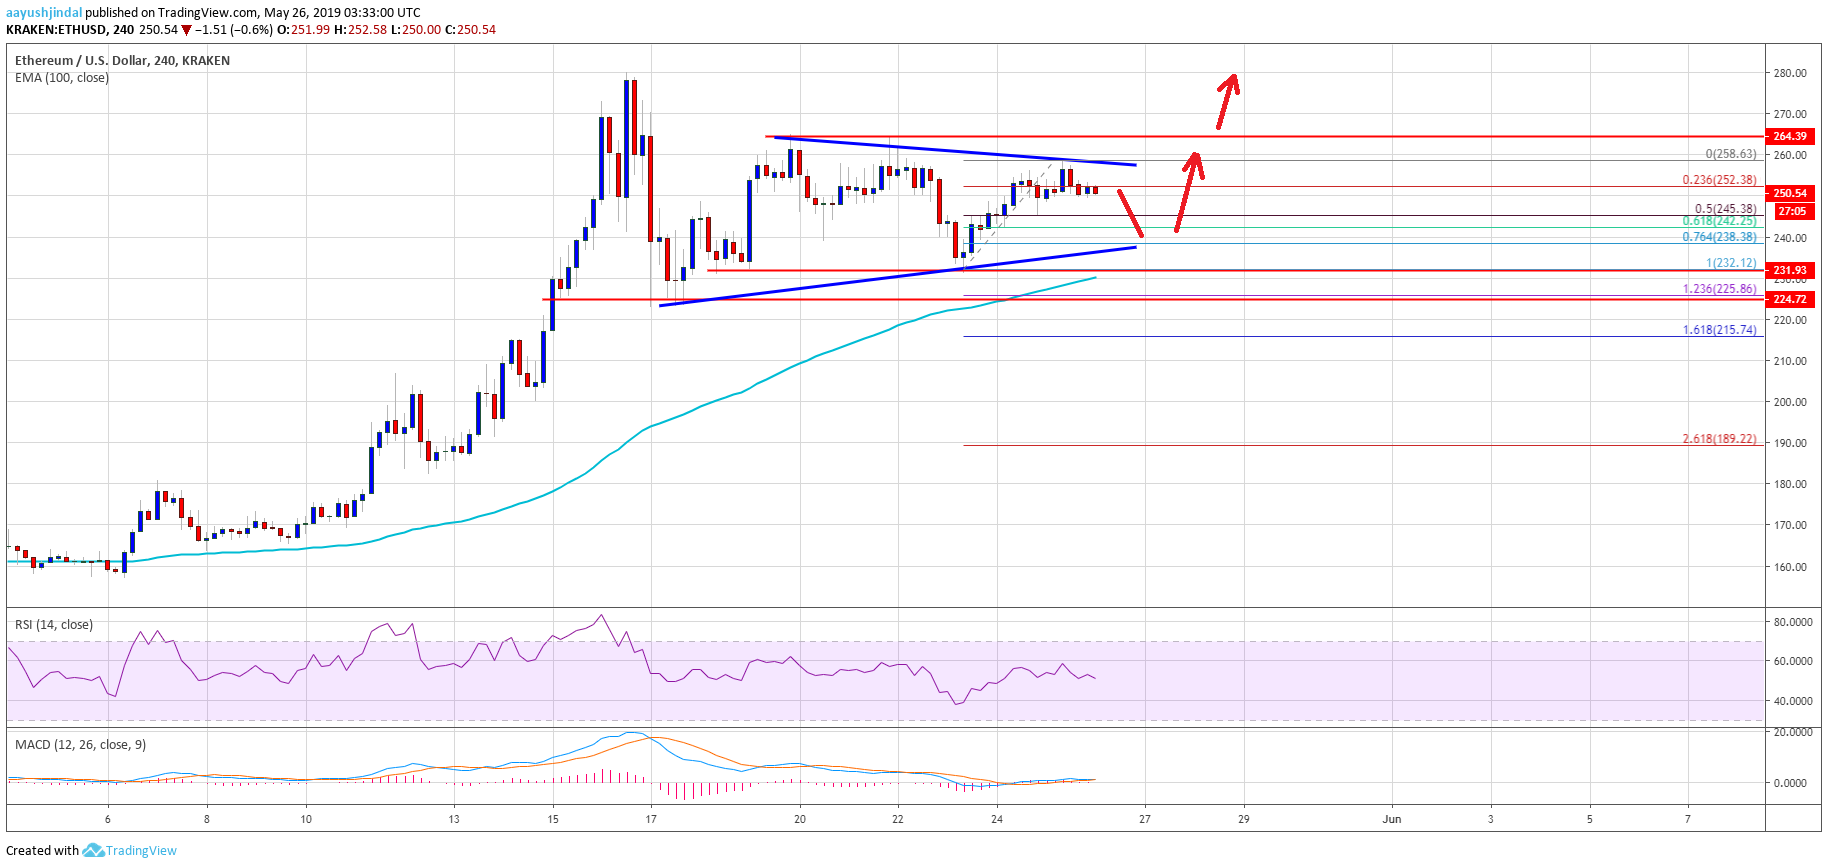
- ETH price seems to be trading in a broad range below the $265 resistance against the US Dollar.
- The price recently recovered after testing the $230-231 support area.
- There is a major contracting triangle forming with resistance at $260 on the 4-hours chart of ETH/USD (data feed via Kraken).
- The pair remains well supported on dips and it is likely to break the $265 and $270 resistances.
Ethereum price is preparing for the next big move versus the US Dollar, similar to bitcoin. ETH could rally strongly once it clears the key $265 resistance level in the near term.
Ethereum Price Weekly Analysis
This past week, Ethereum price mostly traded in a range above the $230 support level against the US Dollar. The ETH/USD pair failed to clear the $265 resistance level and moved towards the range support. It tested the range support near the $231 level and recently started a fresh increase. It climbed back above the $255 level and remained well above the 100 simple moving average (4-hours). The price traded as high as $258.63 and it is currently correcting lower.
On the downside, an immediate support is near the $245 level. Moreover, the 50% Fib retracement level of the last wave from the $232 swing low to $258 swing high is also near the $245 level. Below $245, the next key support is near the $238 level. More importantly, it seems like there is a major contracting triangle forming with resistance at $260 on the 4-hours chart of ETH/USD. The triangle support is near the $238 level, below which the price may test the $232 support area.
If there is a daily close below the $230 support, the price could start a strong decline in the near term. On the upside, the triangle resistance is near the $258 level. However, the main resistances are near $260 and $265. A successful close above the $265 resistance is likely to open the doors for a larger upward move. The next key resistances are near $270 and $280. Above $280, the price could test the $300 level in the coming days.
The above chart indicates that Ethereum seems to be consolidating in a broad range above the $232 support area. On the upside, the bulls must gain momentum above the $265 level to start a strong rally. If they continue to struggle, there are chances of a strong decline below $230.
Technical Indicators
4 hours MACD – The MACD for ETH/USD is slowly moving in the bullish zone.
4 hours RSI – The RSI for ETH/USD recently declined below the 50 level and it could continue to move down.
Major Support Level – $230
Major Resistance Level – $265