
Reason to trust
How Our News is Made
Strict editorial policy that focuses on accuracy, relevance, and impartiality
Ad discliamer
Morbi pretium leo et nisl aliquam mollis. Quisque arcu lorem, ultricies quis pellentesque nec, ullamcorper eu odio.
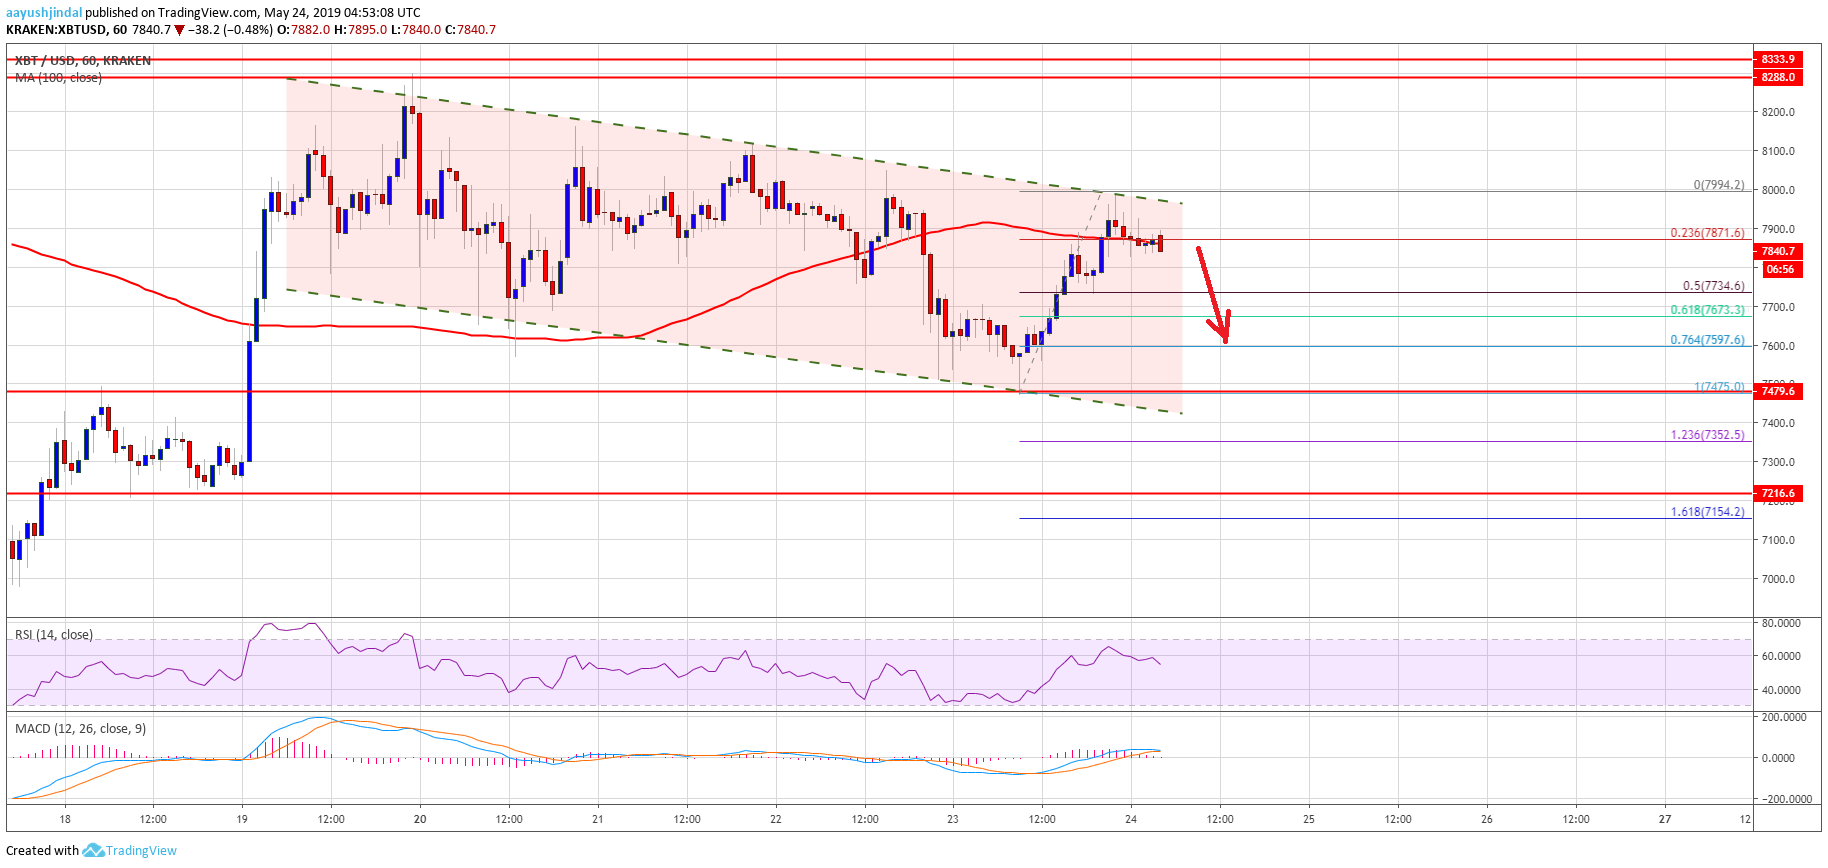
- Bitcoin price declined recently and tested the key $7,500 support area against the US Dollar.
- The price rebounded and traded above the $7,780 and $7,850 resistance levels.
- Yesterday’s highlighted key declining channel is acting as a barrier near $7,980 on the hourly chart of the BTC/USD pair (data feed from Kraken).
- The pair could drop once again towards the $7,720 support area before it starts a fresh increase.
Bitcoin price rebounded nicely above $7,700 and $7,850 against the US Dollar. However, BTC is facing a strong resistance and it could decline again before the bulls take control.
Bitcoin Price Analysis
Yesterday, we saw a major downside correction in bitcoin price below the $7,850 support against the US Dollar. The BTC/USD pair traded below the $7,720 support level and the 100 hourly simple moving average. Besides, it broke the key $7,660 support and tested the $7,500 support area. A swing low was formed at $7,475 and the price recently rebounded nicely above $7,660. The bulls pushed the price above the $7,720 and $7,850 resistance levels.
However, it seems like the price is struggling to gain momentum above $7,950 and $8,000. Moreover, yesterday’s highlighted key declining channel is acting as a barrier near $7,980 on the hourly chart of the BTC/USD pair. The recent high was at $7,994 and the price is currently moving lower. An immediate support is near $7,800, below which the price could test the 50% Fib retracement level of the upward move from the $7,475 low to $7,994 high. The current price action indicates that the price is facing a strong resistance near $7,980 and $8,000.
If there is a successful close above $8,000, the price could start a solid rise towards the $8,200 and $8,300 resistance levels. Conversely, there is a risk of another drop below $7,800. The main support is near $7,670, and the 61.8% Fib retracement level of the upward move from the $7,475 low to $7,994 high.
Looking at the chart, bitcoin price rebounded nicely from the $7,475 level. However, the $8,000 barrier stopped upsides and it might start a fresh decline below $7,800. Once the current correction is complete near $7,670 or $7,600, the price is likely to climb back sharply. In the mentioned case, the price may perhaps surpass the $8,000 resistance. The next key resistances on the upside are near $8,200, $8,300 and $8,500.
Technical indicators:
Hourly MACD – The MACD is about to move back in the bearish zone, with a few negative signs.
Hourly RSI (Relative Strength Index) – The RSI for BTC/USD is currently moving lower and it could test the 50 level.
Major Support Levels – $7,670 followed by $7,600.
Major Resistance Levels – $7,950, $7,980 and $8,000.


