Reason to trust
How Our News is Made
Strict editorial policy that focuses on accuracy, relevance, and impartiality
Ad discliamer
Morbi pretium leo et nisl aliquam mollis. Quisque arcu lorem, ultricies quis pellentesque nec, ullamcorper eu odio.
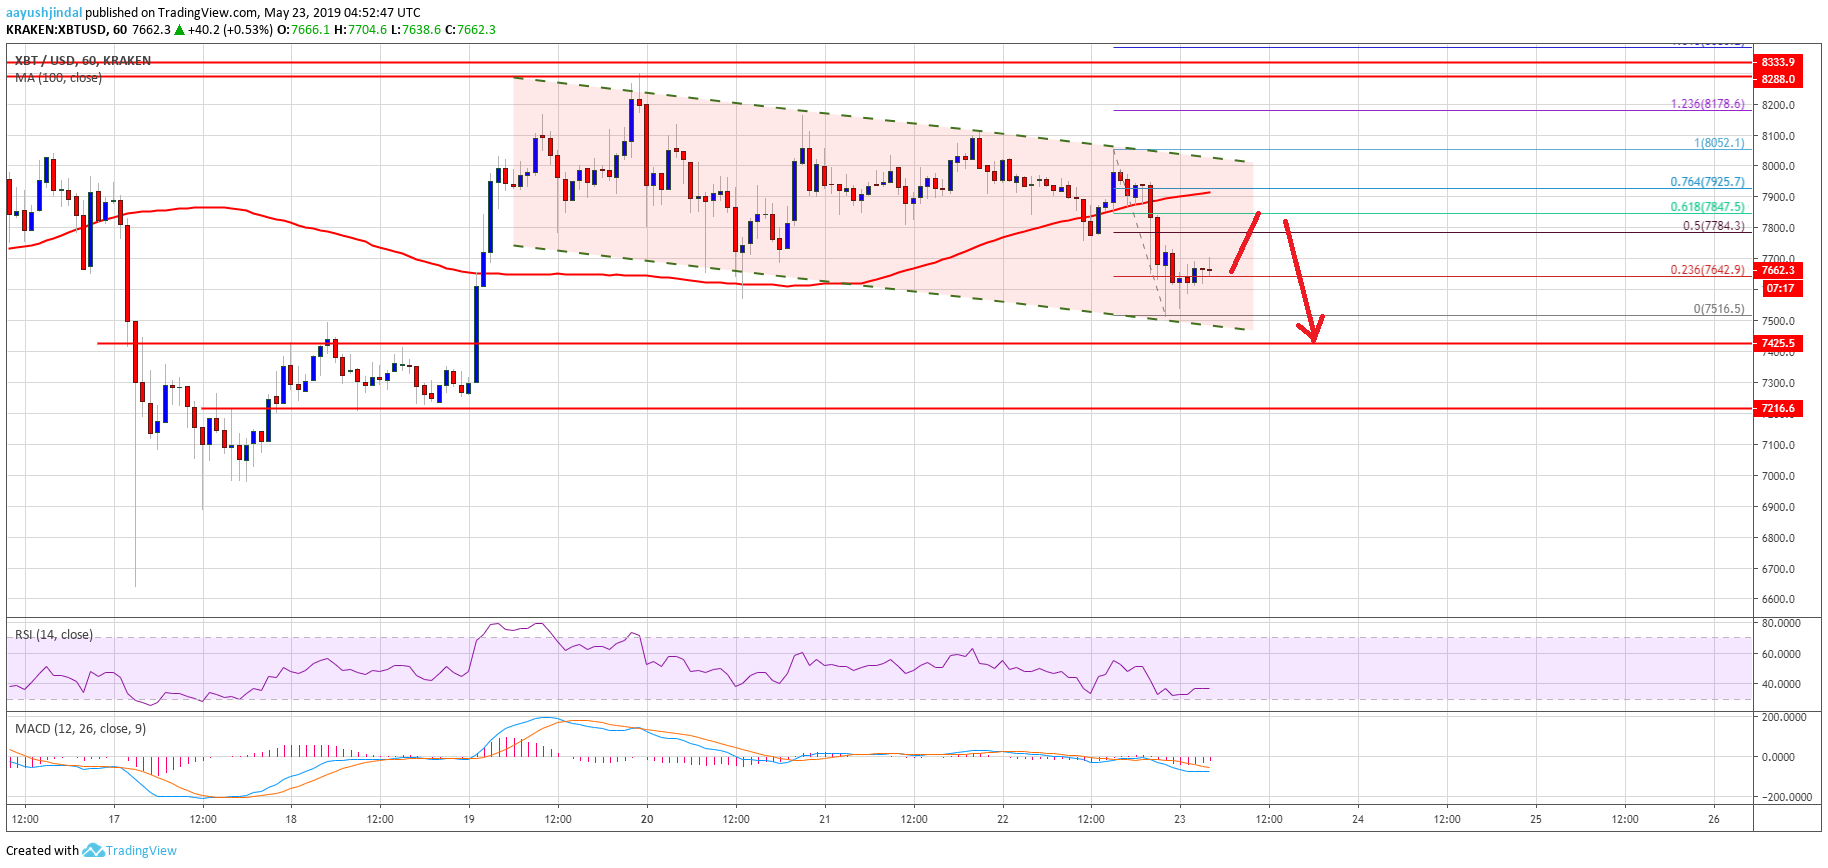
- Bitcoin price is currently under pressure below the $7,800 support area against the US Dollar.
- The price declined recently and it is currently trading just above the $7,500 support area.
- There is a major declining channel in place with resistance at $8,000 on the hourly chart of the BTC/USD pair (data feed from Kraken).
- The pair could decline a few points and there might be a strong bounce from $7,420 or $7,200.
Bitcoin price is slowly moving lower towards key supports against the US Dollar. BTC is likely to bounce back from the $7,400 or $7,200 support levels in the near term.
Bitcoin Price Analysis
Recently, bitcoin price struggled to break the $8,100 and $8,050 resistance levels against the US Dollar. The BTC/USD pair failed near $8,050 recently and started a downward move below $8,000 and $7,940. The price is currently under pressure and it broke the $7,800 support area. It even traded below the $7,660 support level and the 100 hourly simple moving average. Finally, there was a break below the $7,600 support and a new swing low was formed at $7,516.
The price is currently consolidating, with an initial resistance is near the $7,780 level. It represents the 50% Fib retracement level of the recent decline from the $8,052 high to $7,516 low. Above $7,780, the price could test the $7,900 resistance level. Moreover, the 100 hourly simple moving average is close to the $7,900 level to prevent upsides. The 76.4% Fib retracement level of the recent decline from the $8,052 high to $7,516 low is also near the $7,925 level. Therefore, the $7,900 area could act as a strong resistance.
More importantly, there is a major declining channel in place with resistance at $8,000 on the hourly chart of the BTC/USD pair. On the downside, the main support is near $7,500, below which the price could test the $7,425 support area. Below $7,425, the price will most likely revisit the key $7,220 support area.
Looking at the chart, bitcoin price is currently facing an increase in selling pressure below the $7,800 support area. The price might correct higher, but sellers may remain active near the $7,780, $7,800 and $7,900 levels. On the downside, the bulls are likely to protect the $7,500 and $7,400 support levels. In the worst case scenario, the price could test the $7,220 support area before starting a solid increase.
Technical indicators:
Hourly MACD – The MACD is likely to move back in the bullish zone, with a few negative signs.
Hourly RSI (Relative Strength Index) – The RSI for BTC/USD is currently below the 40 level, with a flat structure.
Major Support Levels – $7,500 followed by $7,425.
Major Resistance Levels – $7,780, $7,900 and $8,000.