- ETH price is slowly moving higher and it is currently holding the $250 support against the US Dollar.
- The price is likely to gain pace above the $265 and $270 resistance levels in the near term.
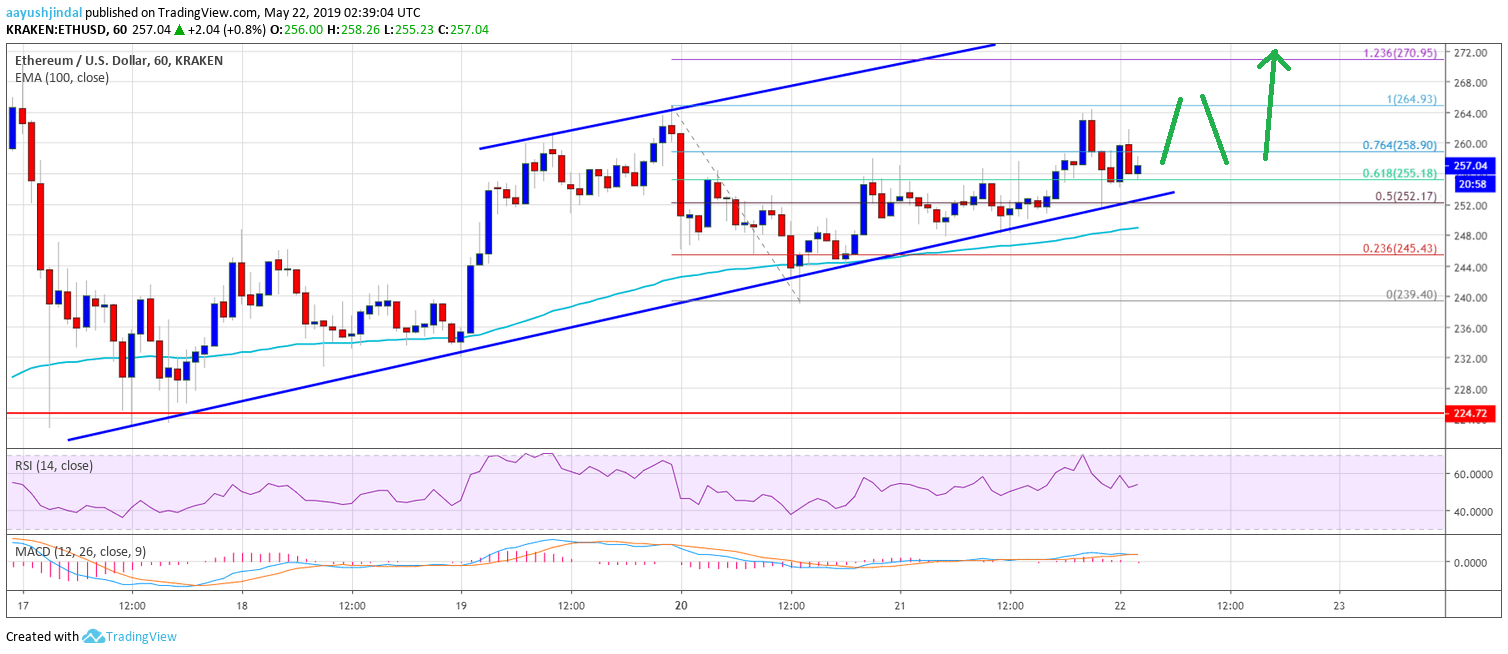
- Yesterday’s highlighted ascending channel is intact with support near $252 on the hourly chart of ETH/USD (data feed via Kraken).
- The pair remains in a decent uptrend and it seems like there could be more gains above $270.
Ethereum price is trading with a positive bias above the $250 support versus the US Dollar, but consolidating vs bitcoin. ETH could continue to rise as long as the $250 support is intact.
Ethereum Price Analysis
In the past few sessions, Ethereum price slowly moved higher from the $239 swing low against the US Dollar. The ETH/USD pair broke the $245 resistance level and settled above 100 hourly simple moving average. The recent rise was positive as there was a break above the 50% Fib retracement level of the last decline from the $265 high to $239 low. The price even broke the $255 resistance area and tagged the $263 level.
There was a spiked above the 76.4% Fib retracement level of the last decline from the $265 high to $239 low. The price traded close to the last swing high near $265 and it is currently moving lower. On the downside, there is a strong support near the $252 and $250 levels. Moreover, yesterday’s highlighted ascending channel is intact with support near $252 on the hourly chart of ETH/USD. Below the channel support, the $250 level and the 100 hourly SMA are important supports. If there is a downside break below $250, the price could move into a bearish zone.
Conversely, if there is an upside break above the $265 swing high, the price could continue moving higher. The next stop could be $270. It represents the 1.236 Fib extension level of the last decline from the $265 high to $239 low. The main resistance above the $270 level is near the $280 level.
Looking at the chart, Ethereum price is currently trading with a positive bias above the $250 support area. Therefore, there are high chances of more gains above the $264 and $265 levels. However, if the bulls continue to struggle near the $265 level, there could be a major downside correction. A clear break below $250 may take the price back towards the $240 level.
ETH Technical Indicators
Hourly MACD – The MACD for ETH/USD is slowing moving into the bearish zone.
Hourly RSI – The RSI for ETH/USD is currently just above the 50 level, with a flat structure.
Major Support Level – $250
Major Resistance Level – $265


