
Reason to trust
How Our News is Made
Strict editorial policy that focuses on accuracy, relevance, and impartiality
Ad discliamer
Morbi pretium leo et nisl aliquam mollis. Quisque arcu lorem, ultricies quis pellentesque nec, ullamcorper eu odio.
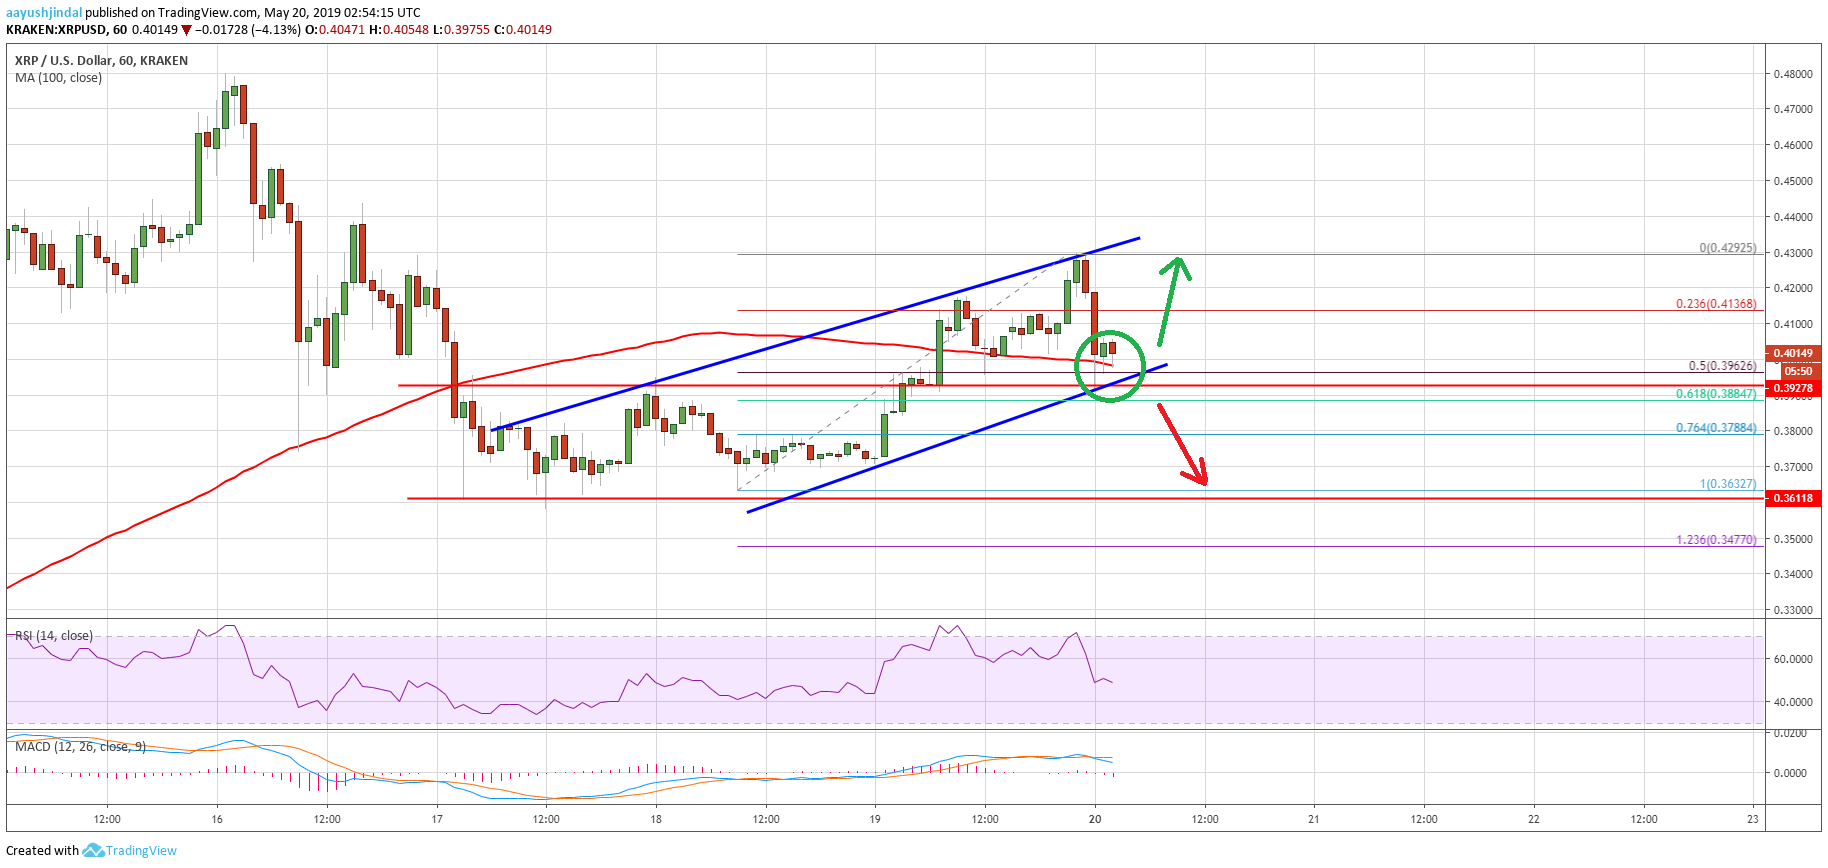
- Ripple price formed support near the $0.3610 level and recently recovered against the US dollar.
- The price traded towards $0.4300 and it is currently correcting lower towards $0.3900.
- There is a short term rising channel forming with support near $0.3950 on the hourly chart of the XRP/USD pair (data source from Kraken).
- The pair is likely to bounce back above $0.4100 or could decline sharply towards the $0.3610 support.
Ripple price seems to be following a decent bullish path against the US Dollar, but struggling vs bitcoin. XRP is likely to find a strong support near $0.3950 and it could climb back above $0.4100.
Ripple Price Analysis
After a strong decline, ripple price found support near the $0.3610 against the US Dollar. The XRP/USD pair started a decent rebound and traded above the $0.3850 and $0.4000 resistance levels. The recent recovered was convincing since the price traded towards $0.4200 and settled above the 100 hourly simple moving average. A swing high was formed at $0.4295 and the price recently corrected lower. It traded below the $0.4150 support and the 23.6% Fib retracement level of the recent leg from the $0.3632 low to $0.4295 high.
The price is now approaching a key support area near the $0.4000 and $0.3950 levels. There is also a short term rising channel forming with support near $0.3950 on the hourly chart of the XRP/USD pair. The 50% Fib retracement level of the recent leg from the $0.3632 low to $0.4295 high is also near the $0.3960 level. Moreover, the 100 hourly simple moving average is also acting as a support near $0.3960. If there is a downside break below the $0.3960 support, there are chances of more losses.
The next key support is near the $0.3780 level. If there are further losses, the price may revisit the $0.3610 support area. Conversely, if the price bounce back, it could retest the $0.4200 and $0.4300 levels. Above $0.4300, the price is likely to rise towards the $0.4500 level.
Looking at the chart, ripple price is clearly trading near a few important supports near the $0.3950 level. Therefore, the price could either bounce back or break $0.3950 to decline further. The technical structure is positive and it seems like there are chances of a fresh increase above $0.4200 and $0.4300. However, a successful follow through above $0.4300 could open the doors for more gains in the near term.
Technical Indicators
Hourly MACD – The MACD for XRP/USD is slowly moving in the bearish zone, with a few negative signs.
Hourly RSI (Relative Strength Index) – The RSI for XRP/USD is just above the 50 level, with a positive angle.
Major Support Levels – $0.3950, $0.3780 and $0.3610.
Major Resistance Levels – $0.4200, $0.4300 and $0.4500.


