
Reason to trust
How Our News is Made
Strict editorial policy that focuses on accuracy, relevance, and impartiality
Ad discliamer
Morbi pretium leo et nisl aliquam mollis. Quisque arcu lorem, ultricies quis pellentesque nec, ullamcorper eu odio.
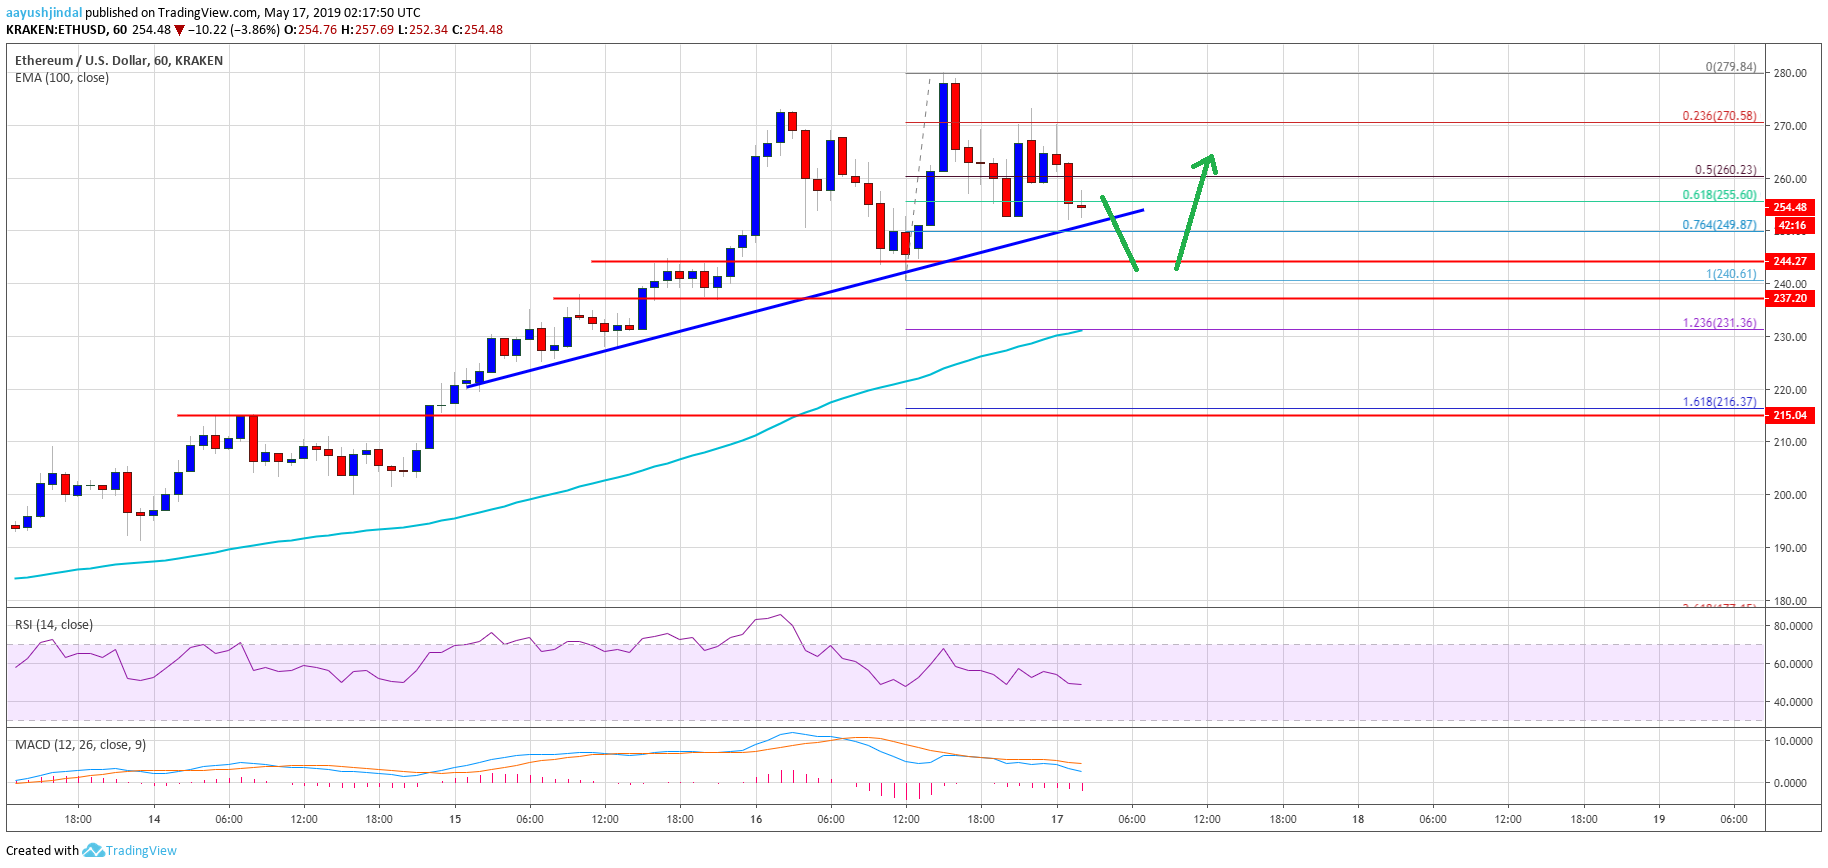
- ETH price climbed further higher and tested $280 before correcting lower against the US Dollar.
- The price started a downside correction and traded below the $270 and $260 supports.
- There is a major bullish trend line forming with support near $252 on the hourly chart of ETH/USD (data feed via Kraken).
- The pair must stay above the $230 support area to avoid an extended downside correction.
Ethereum price climbed towards the $280 level before correcting lower versus the US Dollar and bitcoin. ETH is likely to find support near the $250, $244 and $240 levels in the near term.
Ethereum Price Analysis
After testing the $240 support, Ethereum price started a fresh increase above $260 against the US Dollar. The ETH/USD pair broke the $270 and $275 resistance levels. It traded to a new 2019 high close to the $280 level and recently started a downside correction. There was a break below the $265 and $260 support levels. It seems like the price is struggling to stay above the $270 and $275 levels. Sellers pushed the price below the 50% Fib retracement level of the recent wave from the $240 low to $280 swing high.
The price even broke the $260 support area and spiked below the 61.8% Fib retracement level of the recent wave from the $240 low to $280 swing high. However, the $250-252 support area is currently acting as a strong barrier for sellers. Moreover, there is a major bullish trend line forming with support near $252 on the hourly chart of ETH/USD. Therefore, the pair is likely to find strong bids near the $250 support area. If there is a downside break, the next key support is near the $240 level, where bulls are likely to protect losses.
The next key support below the $240 level is near $231. It coincides with the 1.236 Fib extension level of the recent wave from the $240 low to $280 swing high. More importantly, the 100 hourly simple moving average is also positioned near the $230 zone. Therefore, a break below the $230 level could trigger a nasty downside correction towards $210 or $200.
Looking at the chart, Ethereum price seems to be correcting gains from the $200 swing low. It might continue to struggle, but it is likely to bounce back from $240 or $230. On the upside, a proper close above the $270 barrier is needed for a fresh increase in the near term.
ETH Technical Indicators
Hourly MACD – The MACD for ETH/USD is gaining momentum in the bearish zone.
Hourly RSI – The RSI for ETH/USD slowly moved down and it is currently just below the 50 level.
Major Support Level – $240
Major Resistance Level – $270


