
Reason to trust
How Our News is Made
Strict editorial policy that focuses on accuracy, relevance, and impartiality
Ad discliamer
Morbi pretium leo et nisl aliquam mollis. Quisque arcu lorem, ultricies quis pellentesque nec, ullamcorper eu odio.
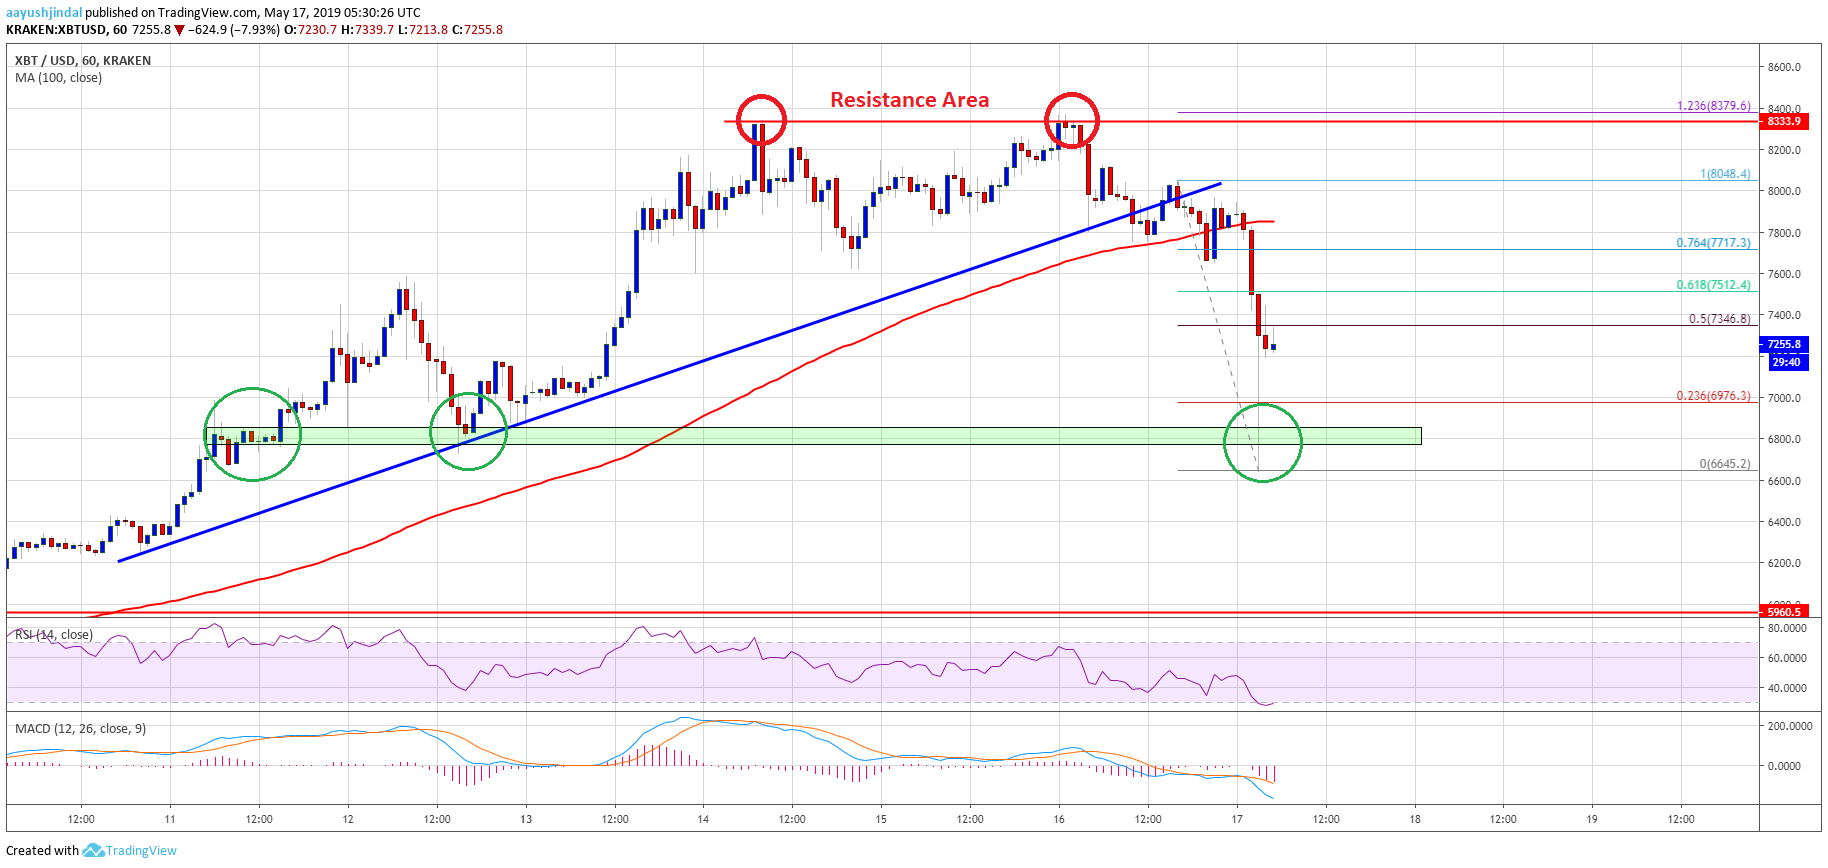
- Bitcoin price formed a double top pattern near $8,330 and declined sharply against the US Dollar.
- The price broke the key supports near $8,000, $7,650 and $7,200 to test the $6,800 support area.
- This week’s followed bullish trend line was breached with support at $7,850 on the hourly chart of the BTC/USD pair (data feed from Kraken).
- The price tested a crucial support area near $6,700-6,800 and bounced back above $7,100.
Bitcoin price started a major downside correction below $8,000 against the US Dollar. BTC formed a double top pattern, but it is now trading close to a few crucial supports near $6,800.
Bitcoin Price Analysis
Recently, bitcoin price made another attempt to climb above the $8,330 and $8,350 resistances against the US Dollar. The BTC/USD pair failed to climb above $8,350 and formed a major double top pattern. As a result, there was a sharp decline below the $8,000 support area. Besides, there was a clear break below the $7,800 support area and the 100 hourly simple moving average.
More importantly, this week’s followed bullish trend line was breached with support at $7,850 on the hourly chart of the BTC/USD pair. The pair declined more than 10% and broke the $7,450 and $7,000 support levels. It spiked towards the $6,650 support area and formed a swing low at $6,645. Recently, it recovered nicely above the $7,000 level and the 23.6% Fib retracement level of the latest drop from the $8,048 high to $6,645 low. The price is now trading above $7,200, but it is facing a strong resistance near $7,350 and $7,400.
Moreover, the 50% Fib retracement level of the latest drop from the $8,048 high to $6,645 low is also acting as a barrier for the bulls. If there is a successful close above $7,400, the price could rebound towards the $7,700 level. Besides, it might test the 76.4% Fib retracement level of the latest drop from the $8,048 high to $6,645 low. Conversely, if the price fails to surpass the $7,400 resistance, it is likely to decline again. An initial support is near $7,000, below which there is a risk of a sharp decline towards the $6,800 or $6,650 support zone.
Looking at the chart, bitcoin price clearly corrected lower significantly below $8,000 and $7,500. However, the $6,800 and $6,650 support levels are important buy zones. In the short term, the price could consolidate near $7,000 before it starts a fresh increase.
Technical indicators:
Hourly MACD – The MACD is gaining momentum in the bearish zone.
Hourly RSI (Relative Strength Index) – The RSI for BTC/USD declined sharply below the 40 and 30 levels.
Major Support Levels – $6,800 followed by $6,650.
Major Resistance Levels – $7,400, $7,700 and $7,850.