
Reason to trust
How Our News is Made
Strict editorial policy that focuses on accuracy, relevance, and impartiality
Ad discliamer
Morbi pretium leo et nisl aliquam mollis. Quisque arcu lorem, ultricies quis pellentesque nec, ullamcorper eu odio.
- Bitcoin price traded to a new 2019 high at $8,370 and recently corrected lower against the US Dollar.
- The price traded below the $8,200 support, but there are many supports above $7,800 and $7,600.
- This week’s followed bullish trend line could provide support at $7,800 on the hourly chart of the BTC/USD pair (data feed from Kraken).
- There were strong gains in Ethereum (broke $265) and ripple (tested $0.4800) in the past few hours.
Bitcoin price traded further higher before it faced sellers near $8,370 against the US Dollar. BTC is currently correcting lower, but dips remain well supported above $7,800 and $7,600.
Bitcoin Price Analysis
Yesterday, we discussed the chances of more gains in bitcoin price above $8,300 against the US Dollar. The BTC/USD pair did extend upsides above $8,280 and $8,300. The pair even traded to a new 2019 high near $8,370, but it failed to continue higher. As a result, the price started a fresh downside correction below the $8,300 and $8,280 support levels. The price even broke the $8,200 support, but stayed well above the 100 hourly simple moving average.
During the decline, there was a break below the 50% Fib retracement level of the upside from the $7,625 low to $8,370 high. Besides, the price traded below an ascending channel with support near $8,200 on the hourly chart. It opened the doors for more losses and the price spiked below $8,000. BTC price even traded below the 61.8% Fib retracement level of the upside from the $7,625 low to $8,370 high. However, the $7,800 level acted as a strong support. More importantly, this week’s followed bullish trend line could provide support at $7,800 on the hourly chart of the BTC/USD pair.
The pair tested the trend line and the 76.4% Fib retracement level of the upside from the $7,625 low to $8,370 high. It seems like the price remains well supported above $7,800. If there is a break below the trend line, the price may test the next support near the $7,650, $7,630 and $7,610 levels. Moreover, the 100 hourly SMA is also near the $7,650 level to act as strong support.
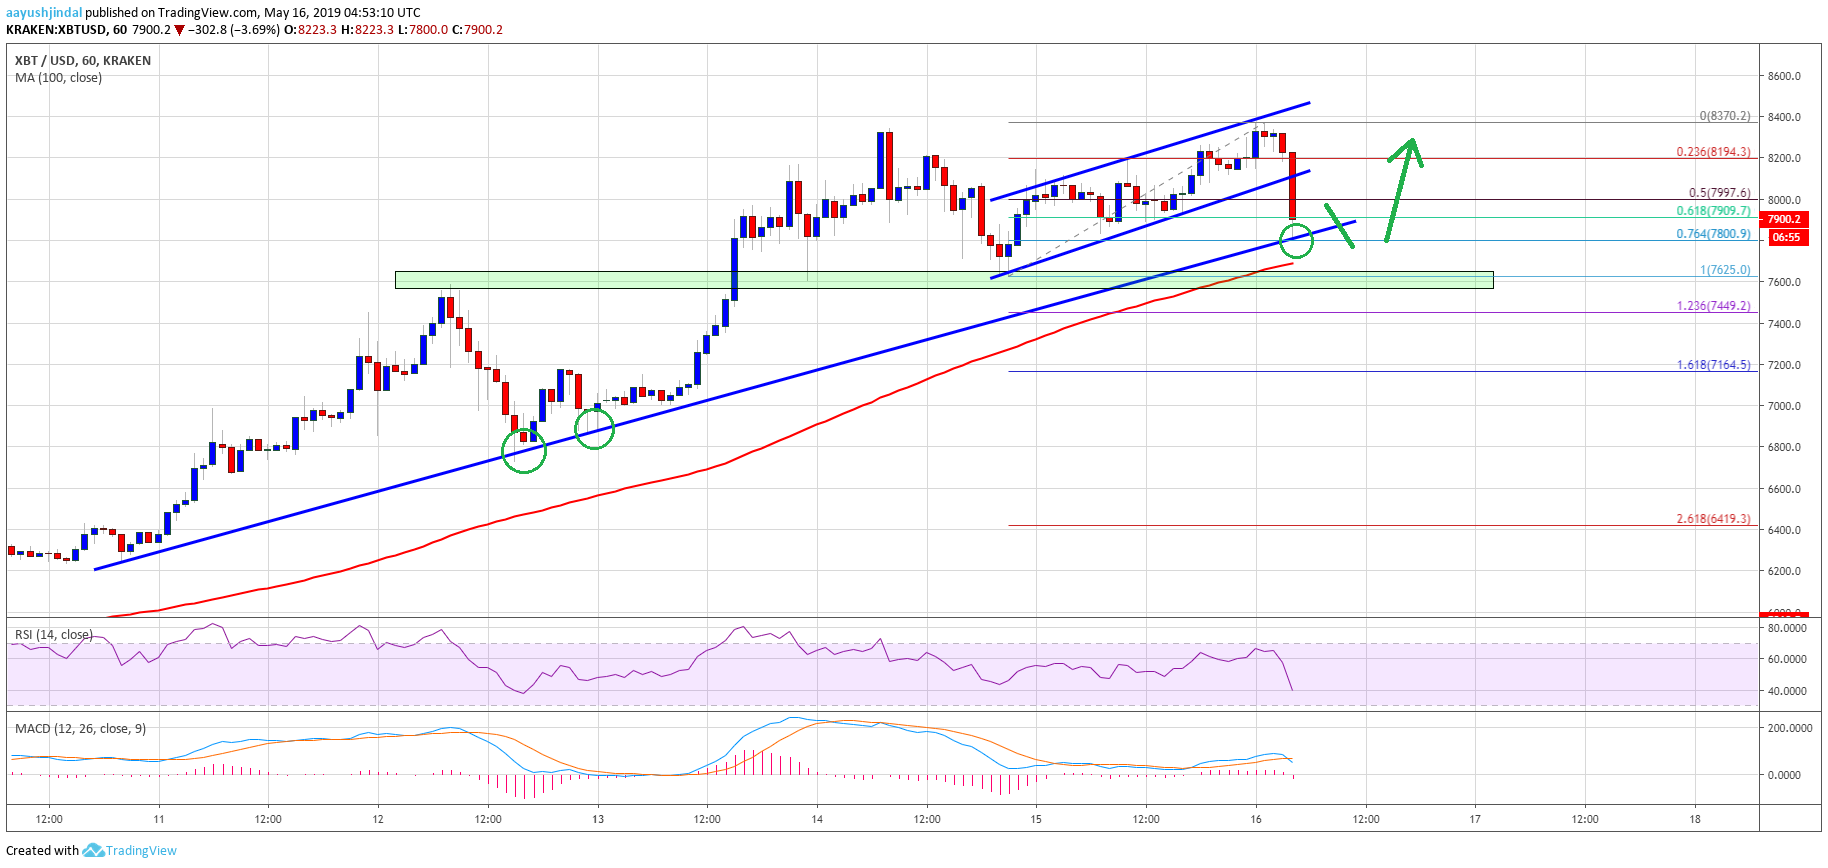
Looking at the chart, bitcoin price is clearly started a much needed downside correction from $8,370. Having said that, dips remain supported and the price is likely to finds strong bids near $7,800 or $7,600. Only a close below $7,600 and the 100 hourly SMA might start an extended downside correction.
Technical indicators:
Hourly MACD – The MACD is slowly moving into the bearish zone.
Hourly RSI (Relative Strength Index) – The RSI for BTC/USD declined sharply below the 50 and 45 levels.
Major Support Levels – $7,800 followed by $7,600.
Major Resistance Levels – $8,000, $8,150 and $8,370.


