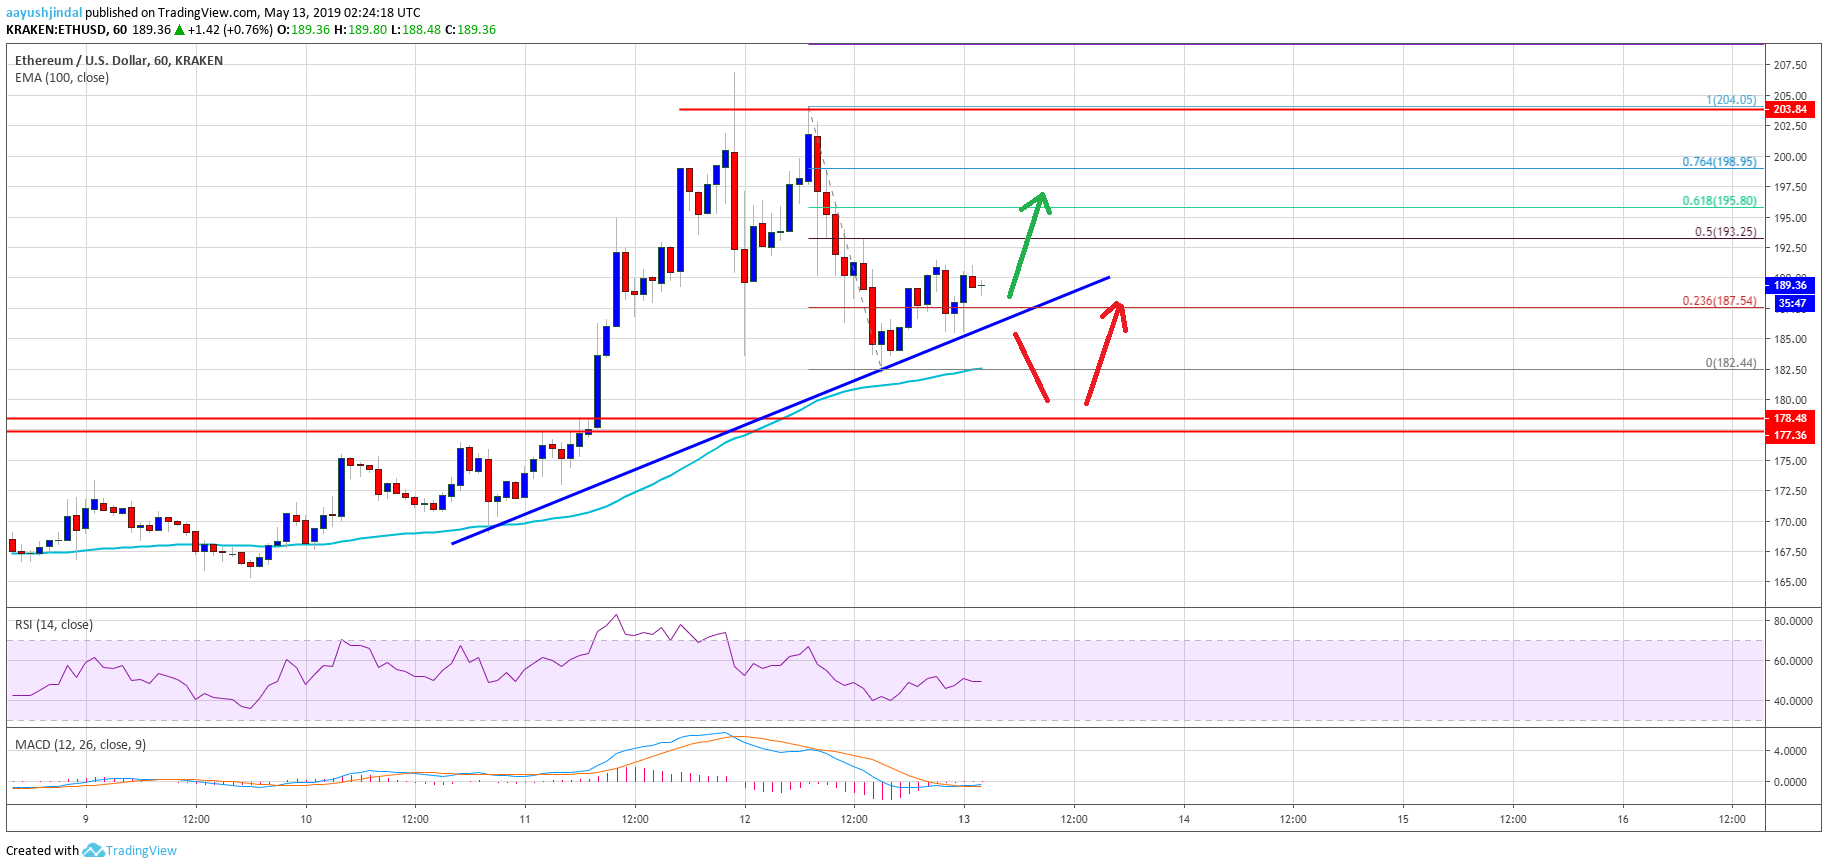
- ETH price climbed to a new 2019 high above $200 before correcting lower against the US Dollar.
- The price declined below the $195 and $190 support levels before the bulls appeared near $182.
- There is a new connecting bullish trend line forming with support near $186 on the hourly chart of ETH/USD (data feed via Kraken).
- The pair remains supported on dips and it seems like it could bounce back above $194.
Ethereum price started a downside correction versus the US Dollar, similar to bitcoin. ETH price remains well supported on the downside near $185 and $180.
Ethereum Price Analysis
In the past three days, there was a steady rise in Ethereum price above $180 resistance against the US Dollar. The ETH/USD pair followed bitcoin and broke a few important resistances near $190 and $195. There was even a break above the $200 barrier. The price traded close to the $208 level and settled well above the 100 hourly simple moving average. Recently, it started a downside correction and declined below the $195 and $190 support levels. The price even spiked below the $185 support and traded close to $182.
However, the price is trading well above the $180 support and the 100 hourly SMA. It has already recovered above the 23.6% Fib retracement level of the recent drop from the $204 swing high to $182 swing low. An immediate resistance on the upside is near the $193-194 zone. Besides, the 50% Fib retracement level of the recent drop from the $204 swing high to $182 swing low is also near $193. A successful break above the $194 level might set the pace for a fresh rise towards the $200 resistance area.
On the downside, an immediate support is near the $186 level. There is also a new connecting bullish trend line forming with support near $186 on the hourly chart of ETH/USD. If there is a downside break below the trend line, the price may test the 100 hourly SMA or the main support near $178.

Looking at the chart, Ethereum price seems to be correcting gains, but it remains well supported near $185 and $180. The key support is near the $178 level (the previous resistance). As long as the price is above the $178 support, it is likely bounce back. A fresh daily close above the $200 resistance is likely to trigger a strong rally in the coming sessions.
ETH Technical Indicators
Hourly MACD – The MACD for ETH/USD is about to move back in the bullish zone.
Hourly RSI – The RSI for ETH/USD is currently just below the 50 level, with a minor bearish angle.
Major Support Level – $180
Major Resistance Level – $194


