
Reason to trust
How Our News is Made
Strict editorial policy that focuses on accuracy, relevance, and impartiality
Ad discliamer
Morbi pretium leo et nisl aliquam mollis. Quisque arcu lorem, ultricies quis pellentesque nec, ullamcorper eu odio.
- Bitcoin price was unfazed and it recently broke the $6,200 resistance level against the US Dollar.
- The price even broke the $6,300 level and it seems like the bulls are now aiming $6,500.
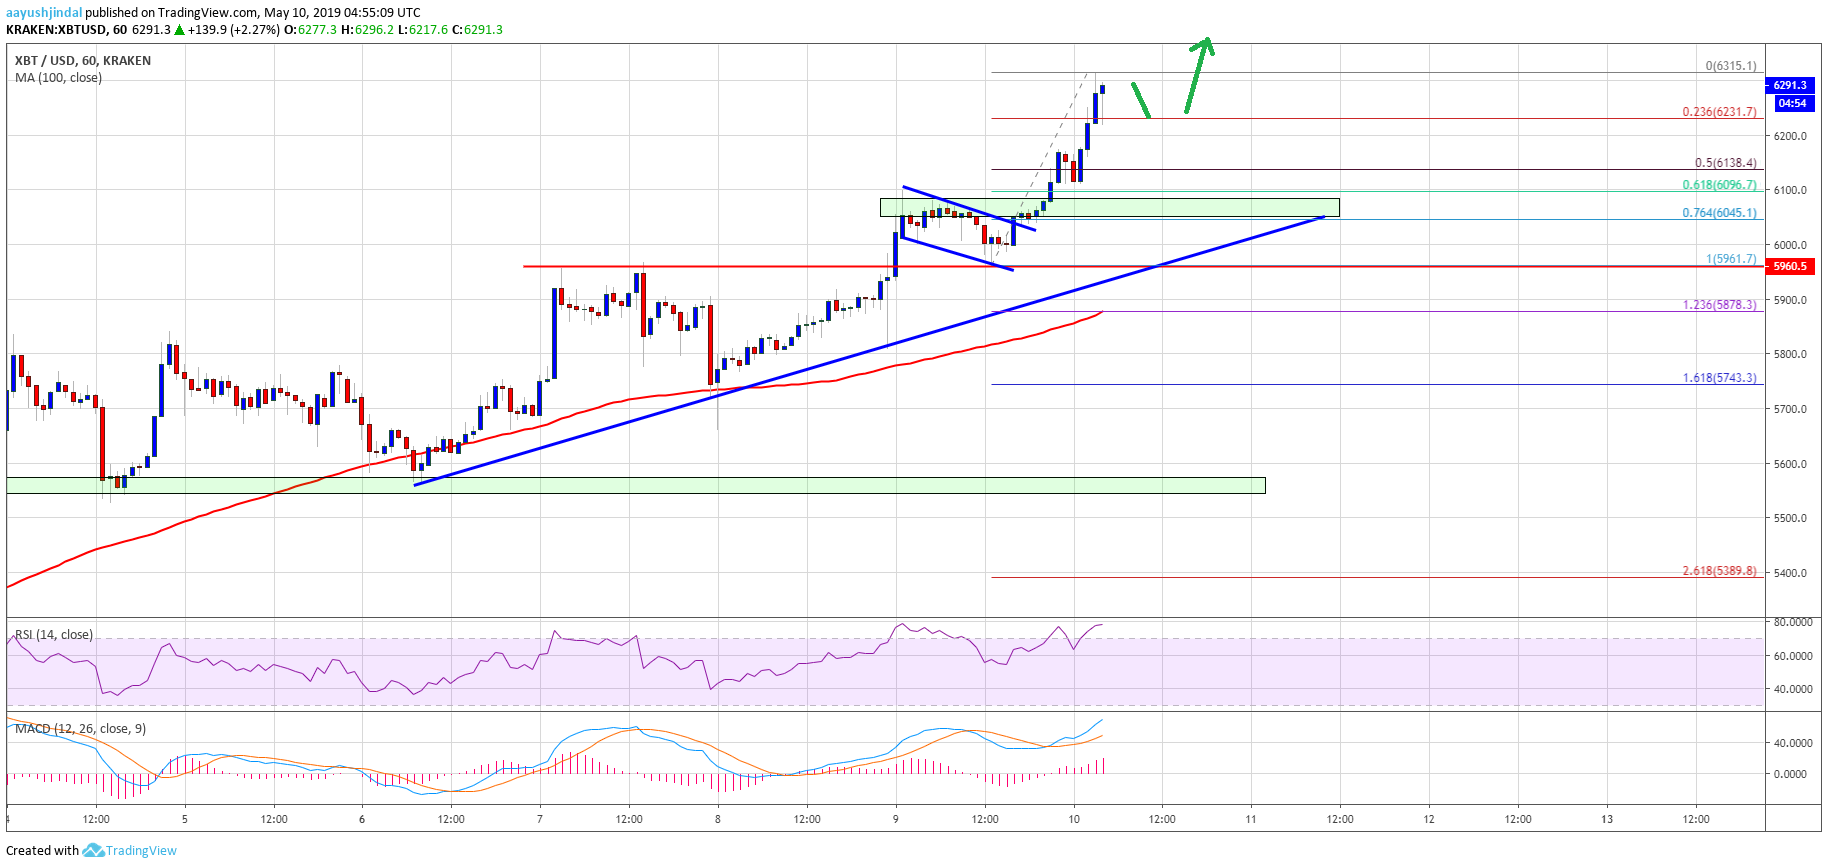
- There is a major bullish trend line forming with support at $6,050 on the hourly chart of the BTC/USD pair (data feed from Kraken).
- The pair could find a strong buying interest if it corrects lower towards $6,100 or $6,000.
Bitcoin price rallied more than 4% and cleared $6,300 against the US Dollar. BTC remains in a strong uptrend and it seems like the bulls are now aiming a test of $6,400 or even $6,500.
Bitcoin Price Analysis
This week, bitcoin price overcame all hurdles and rallied above $6,000 and $6,200 against the US Dollar. The BTC/USD pair gained bullish momentum after it settled above $6,100 and the 100 hourly simple moving average. Recently, it broke a bullish flag pattern with resistance near $6,040 on the hourly chart to start a strong upward move. As a result, the bulls pushed the price above the $6,250 and $6,300 resistance levels. A new 2019 high was formed at $6,315 and the price is likely to extend gains.
An initial support is near the $6,230 level, and the 23.6% Fib retracement level of the recent rally from the $5,961 low to $6,315 high. If there is a downside extension, the next key support could be $6,140. It represents the 50% Fib retracement level of the recent rally from the $5,961 low to $6,315 high. More importantly, there is a major bullish trend line forming with support at $6,050 on the hourly chart of the BTC/USD pair. Moreover, the previous resistance area near $6,050 is likely to act as a strong buy zone if the price corrects lower.
Besides, the price is now well above the $6,000 pivot level and the bullish 100 hourly SMA. Therefore, there are chances of more upsides above the $6,300 and $6,350 levels. The next main hurdle is near the $6,400 level, above which the price could rally towards the $6,500 level.
Looking at the chart, bitcoin price is gaining bullish momentum above $6,200 and $6,300, with no major bearish sign. In the short term, there could be a few bearish moves, but dips remain supported near the $6,200 and $6,100 levels. Only a daily close below $6,000 and the 100 hourly SMA could start a substantial downside correction.
Technical indicators:
Hourly MACD – The MACD is currently placed heavily in the bullish zone, with positive signs.
Hourly RSI (Relative Strength Index) – The RSI for BTC/USD is currently correcting lower in the overbought zone.
Major Support Levels – $6,200 followed by $6,140.
Major Resistance Levels – $6,300, $6,400 and $6,500.