
Reason to trust
How Our News is Made
Strict editorial policy that focuses on accuracy, relevance, and impartiality
Ad discliamer
Morbi pretium leo et nisl aliquam mollis. Quisque arcu lorem, ultricies quis pellentesque nec, ullamcorper eu odio.
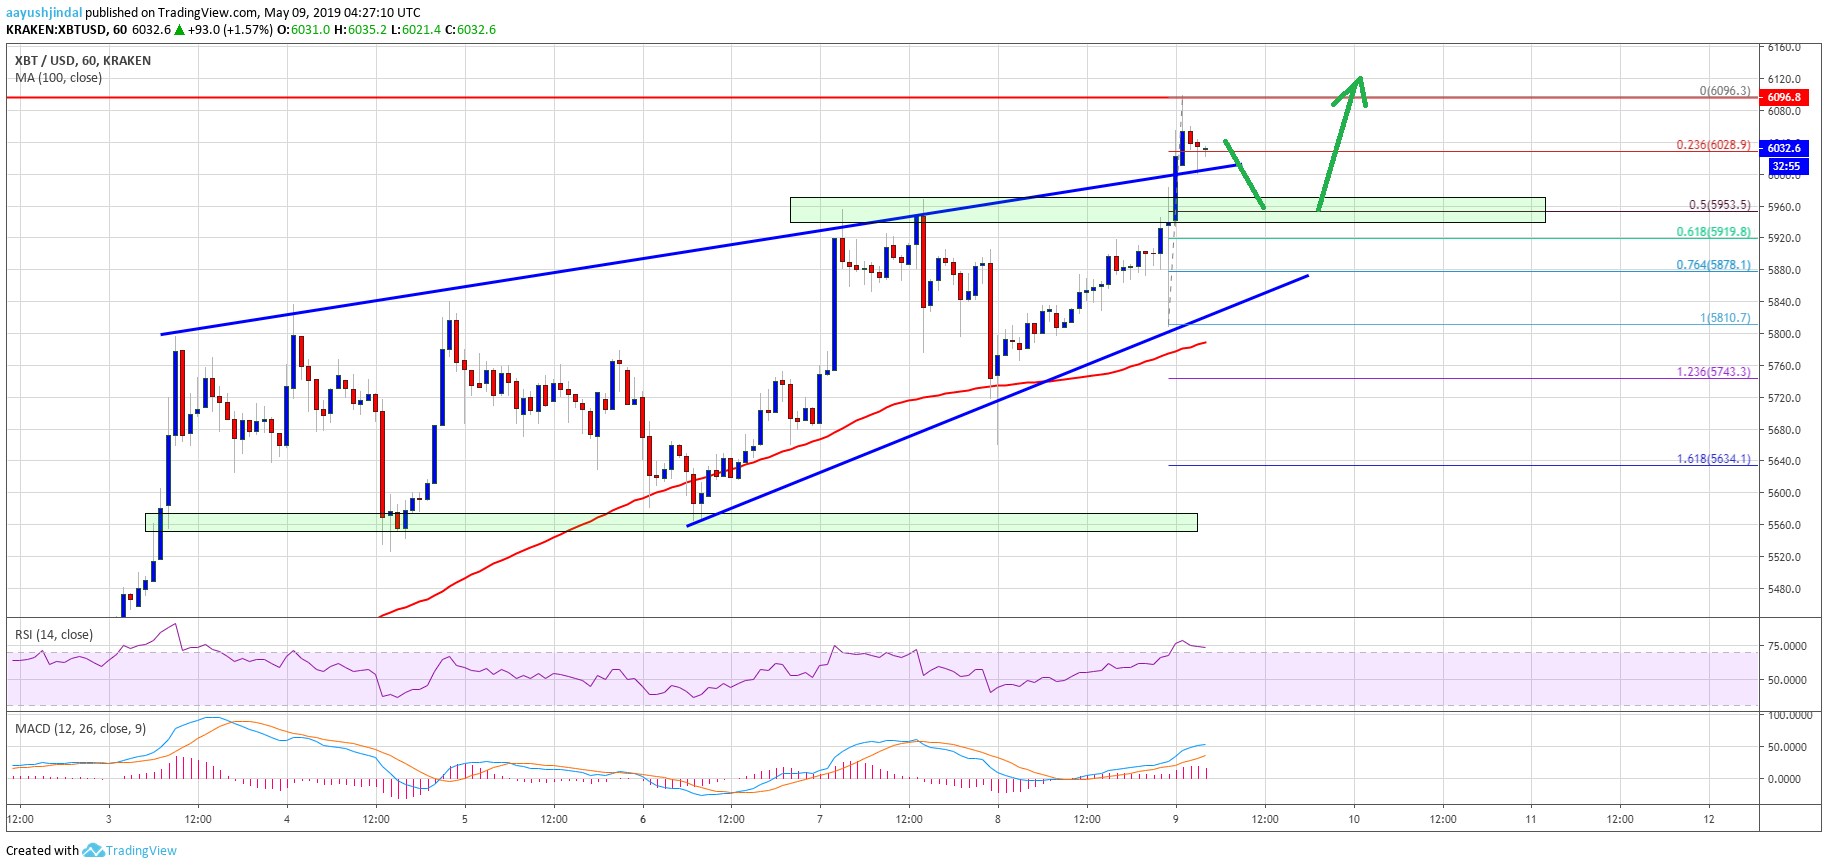
- Bitcoin price extended gains and traded to a new 2019 high above $6,080 against the US Dollar.
- The price surged higher towards the $6,100 level and it is currently consolidating gains.
- There was a break above a connecting trend line with resistance at $6,005 on the hourly chart of the BTC/USD pair (data feed from Kraken).
- The pair remains well supported on the downside, but there are many hurdles near $6,100 and $6,200.
Bitcoin price surging higher with a bullish bias above $6,000 against the US Dollar. BTC could surge towards the $6,200 level before a strong downside correction.
Bitcoin Price Analysis
Yesterday, there was a sharp decline in bitcoin price below $5,900 against the US Dollar due to the Binance exchange security breach. The BTC/USD pair declined below the $5,800 level and the 100 hourly simple moving average. However, the $5,660 level acted as a strong support, resulting in a fresh rise. The price started a strong rise and broke the $5,900 and $5,950 resistance levels. There was even a close above the $5,950 level and the 100 hourly SMA.
During the rise, there was a break above a connecting trend line with resistance at $6,005 on the hourly chart of the BTC/USD pair. The pair climbed above the $6,050 level and traded to a new 2019 high above $6,080. A swing high was formed at $6,096 and the price is currently consolidating gains. An initial support is near $6,020, the broken trend line, and the 23.6% Fib retracement level of the last wave from the $5,810 low to $6,096 high. If there is a break below $6,020 and $6,000, the price may test the $5,950 support zone. It represents a strong support and coincides with the 50% Fib retracement level of the last wave from the $5,810 low to $6,096 high.
If there is a downside extension, the next support is at $5,920. There is also a connecting bullish trend line on the same chart with support near $5,880. Therefore, the price remains well supported on the downside near $6,020, $6,000 and $5,950. On the upside, there are many hurdles for the bulls near $6,100 and $6,200.
Looking at the chart, bitcoin price is clearly placed in a strong uptrend above $5,950. Having said that, the price could start a crucial downside correction at any moment or from the $6,100 and $6,200 resistances.
Technical indicators:
Hourly MACD – The MACD is currently is gaining pace in the bullish zone, with positive signs.
Hourly RSI (Relative Strength Index) – The RSI for BTC/USD is currently in the overbought zone above the 75 level.
Major Support Levels – $6,000 followed by $5,950.
Major Resistance Levels – $6,080, $6,100 and $6,200.


