
Reason to trust
How Our News is Made
Strict editorial policy that focuses on accuracy, relevance, and impartiality
Ad discliamer
Morbi pretium leo et nisl aliquam mollis. Quisque arcu lorem, ultricies quis pellentesque nec, ullamcorper eu odio.
- ETH price corrected lower recently, but stayed above the key $156-157 support against the US Dollar.
- The price is facing a lot of hurdles near the $162 and $163 levels on the upside.
- There is a short term declining channel in place with resistance near $163 on the hourly chart of ETH/USD (data feed via Kraken).
- The pair must stay above the $156 support to avoid a downside break in the near term.
Ethereum price is facing a lot of selling interest versus the US Dollar and bitcoin. ETH could bounce back above $163 as long as the $156 support area is intact.
Ethereum Price Analysis
Recently, there was a decent upward move above $165 in Ethereum price against the US Dollar. The ETH/USD pair spiked towards the $170 resistance, but it failed to hold gains. There was no clear break above the $168-169 resistance zone. As a result, there was a downside correction below the $165 and $163 levels. The price even broke the $160 level and the 100 hourly simple moving average. However, the $156-157 support area acted as a strong buy zone.
The price recently traded above the $162 level, and the 23.6% Fib retracement level of the last decline from the $169 swing high to $157 swing low. There are recovery signs visible, but it seems like the $163 level is acting as a significant resistance. It also represents the 50% Fib retracement level of the last decline from the $169 swing high to $157 swing low. At the outset, the price is moving lower and trading just above the key $156-157 support area. If the bulls fail to defend the $156 support area, there is a risk of a sharp decline.
The next key support is near the $155 level, below which Ether price could decline towards the $150 support level. On the upside, the price must clear the $163 level to start a decent upward move. There is also a short term declining channel in place with resistance near $163 on the hourly chart of ETH/USD.
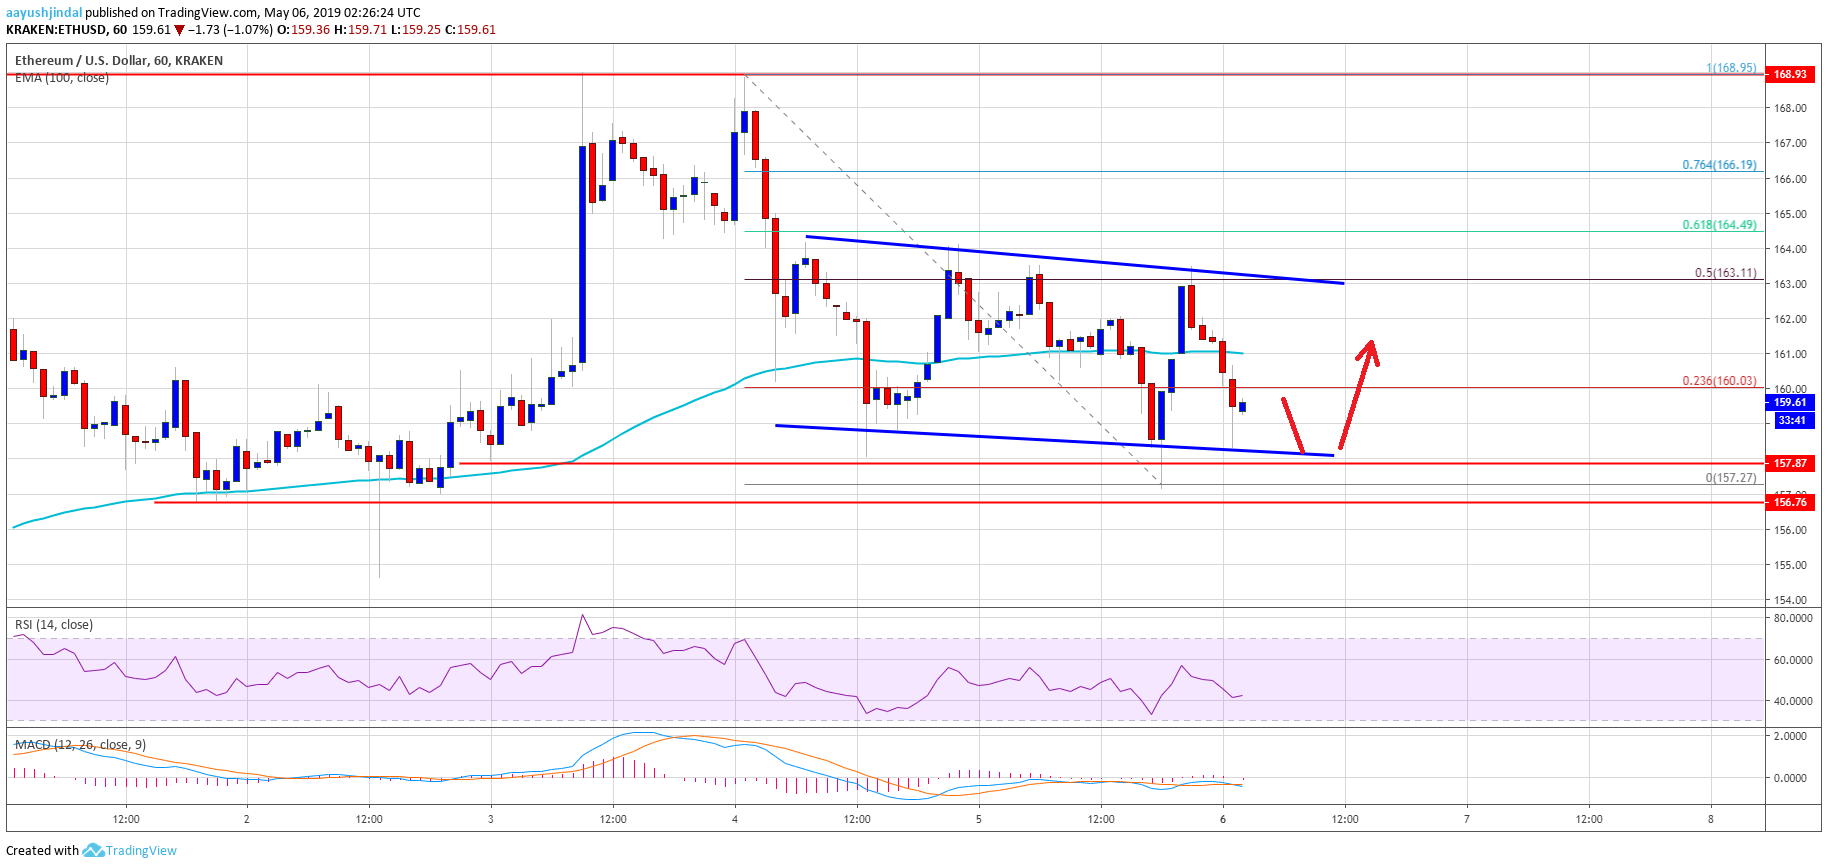
Looking at the chart, Ethereum price may trade in a range above the $157 support for some time before the next break. The chances of a fresh increase are high as long as bitcoin price is gaining strength. If there is a downside break below $155, it could put a lot of pressure on the bulls in the near term.
ETH Technical Indicators
Hourly MACD – The MACD for ETH/USD is currently in the bearish zone, with a few negative signs.
Hourly RSI – The RSI for ETH/USD recently declined below the 50 level, but holding the 40 level.
Major Support Level – $157
Major Resistance Level – $163


