
Reason to trust
How Our News is Made
Strict editorial policy that focuses on accuracy, relevance, and impartiality
Ad discliamer
Morbi pretium leo et nisl aliquam mollis. Quisque arcu lorem, ultricies quis pellentesque nec, ullamcorper eu odio.
- Bitcoin price is following a steady uptrend and recently broke $5,450 against the US Dollar.
- The price surged above $5,580 against the USDT and it is currently near $5,500 vs USD on Kraken.
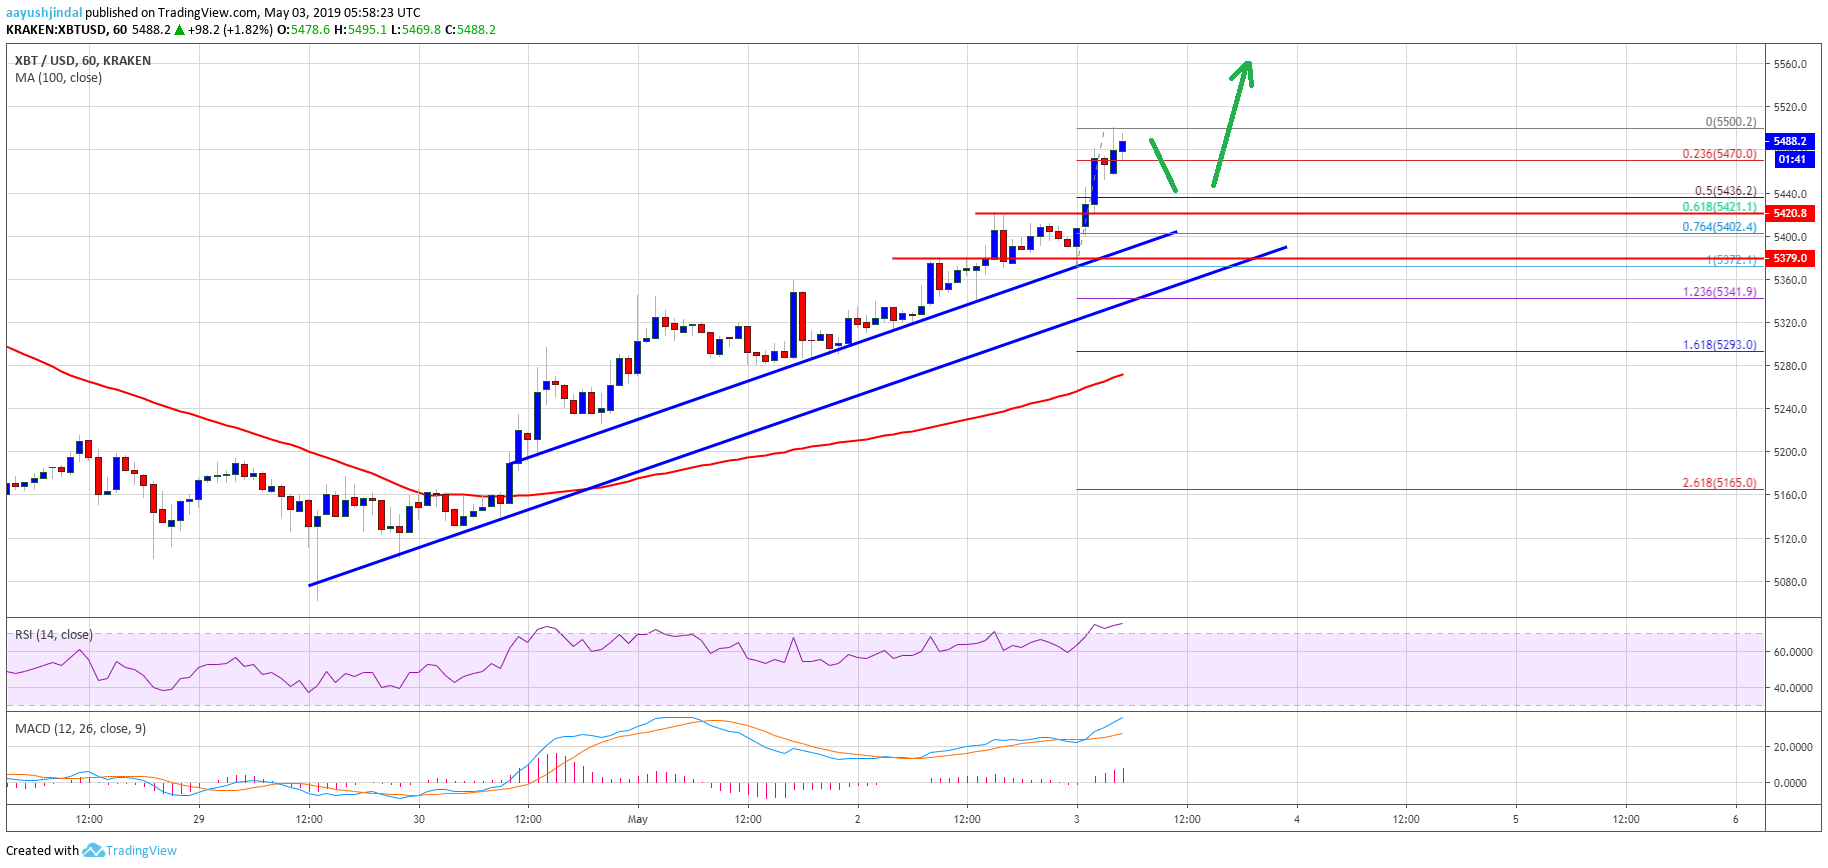
- Yesterday’s two bullish trend lines are intact with support near $5,410 and $5,380 on the hourly chart of the BTC/USD pair (data feed from Kraken).
- The pair is likely to accelerate gains above the $5,500 and $5,550 levels in the coming sessions.
Bitcoin price is climbing steadily against the US Dollar, while surging versus USDT. BTC is likely to remain in an uptrend towards the $5,600 and $5,650 resistance levels.
Bitcoin Price Analysis
After forming a strong support near $5,120, bitcoin price started a solid uptrend against the US Dollar. The BTC/USD pair broke the $5,300 and $5,380 resistance levels to enter a bullish zone. There was a positive close above the $5,400 level and the 100 hourly simple moving average. The price extended gains above the $5,450 level recently and traded to a new weekly high at $5,500. The current price action is very positive, signaling more gains above $5,550 and $5,600.
An immediate support is at $5,470, and the 23.6% Fib retracement level of the recent move from the $5,372 low to $5,500 high. However, the main support is near the $5,420 level. An intermediate support is at $5,435, and the 50% Fib retracement level of the recent move from the $5,372 low to $5,500 high. Besides, yesterday’s two bullish trend lines are intact with support near $5,410 and $5,380 on the hourly chart of the BTC/USD pair. Therefore, if there is a downside correction, the price is likely to find bids near $5,430 or $5,400.
On the upside, a clear break above the $5,550 and $5,520 levels is likely to push the price towards the $5,600 level. The next key resistance is at $5,640, above which the price may test the $5,700 barrier.
Looking at the chart, bitcoin price is clearly trading in a strong uptrend above $5,400. Looking at the USDT pairs, BTC traded towards $5,600 on binance, and above $5,800 on bitfinex. The overall price action is very bullish and it seems like there could be more gains above $5,500 versus USD. In the short term, there could be a downside correction, but dips remain well supported near the $5,400 pivot level. Only a close below $5,280 and the 100 SMA might negate the current bullish view.
Technical indicators:
Hourly MACD – The MACD is gaining strong momentum in the bullish zone.
Hourly RSI (Relative Strength Index) – The RSI for BTC/USD is now in the overbought zone.
Major Support Levels – $5,420 followed by $5,400.
Major Resistance Levels – $5,520, $5,550 and $5,600.