
Reason to trust
How Our News is Made
Strict editorial policy that focuses on accuracy, relevance, and impartiality
Ad discliamer
Morbi pretium leo et nisl aliquam mollis. Quisque arcu lorem, ultricies quis pellentesque nec, ullamcorper eu odio.
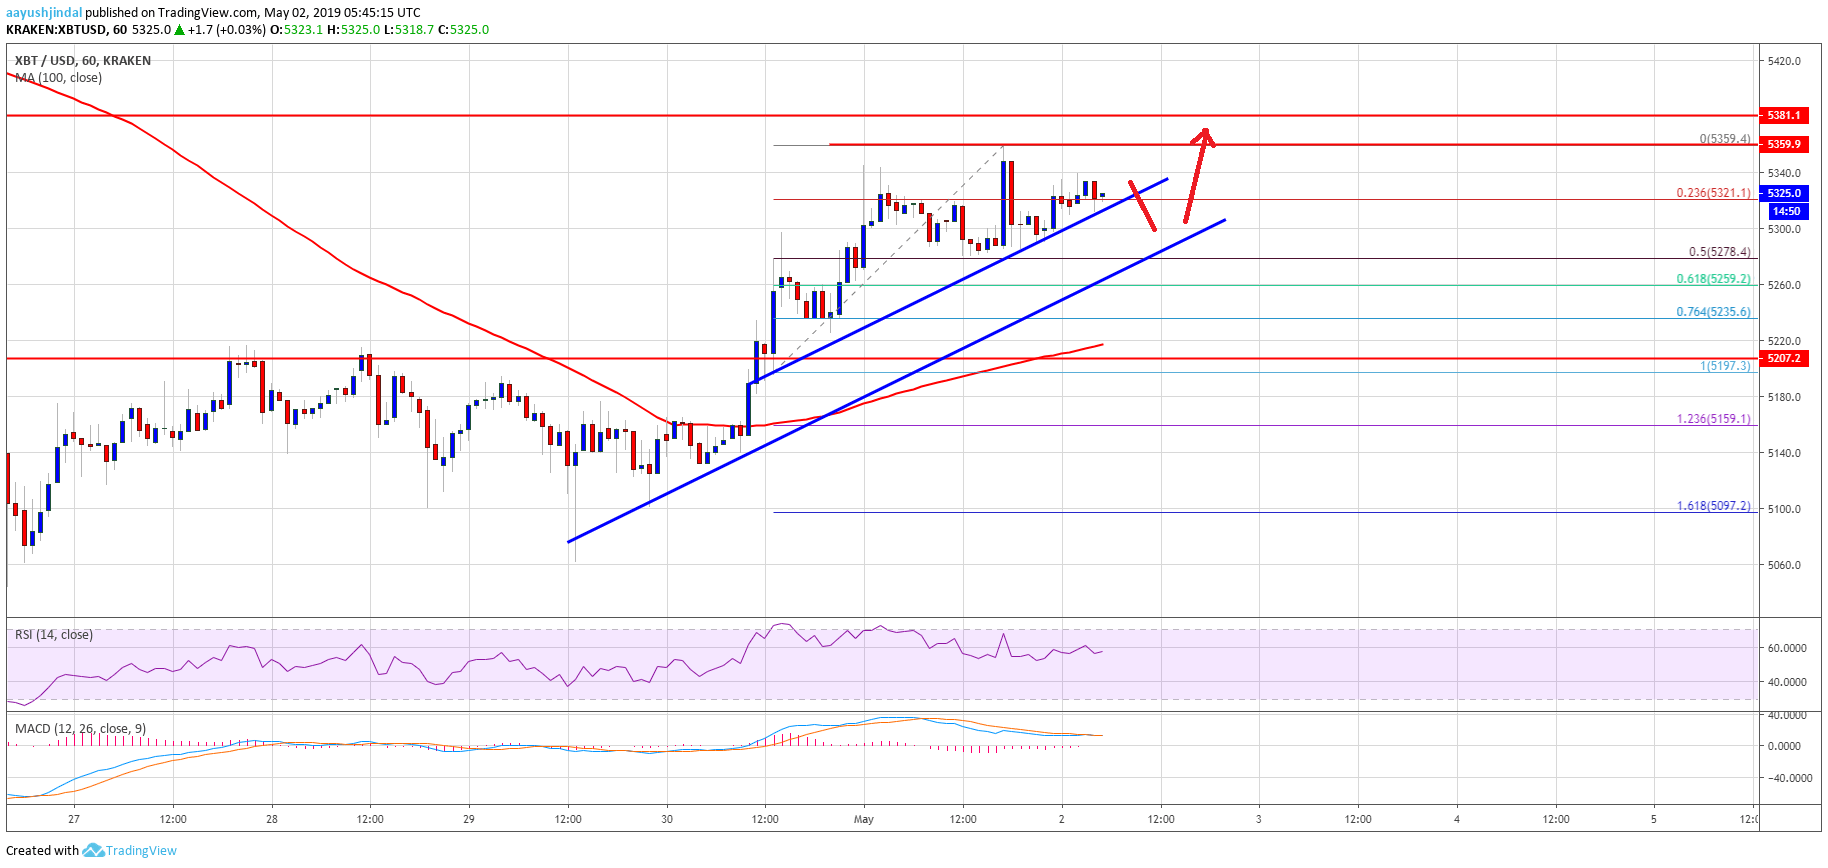
- Bitcoin price traded above the $5,300 resistance and tested $5,360 against the US Dollar.
- The price is currently trading with a bullish bias above the $5,280 and $5,250 supports.
- There are two bullish trend lines formed with support near $5,320 and $5,280 on the hourly chart of the BTC/USD pair (data feed from Kraken).
- The pair remains supported on dips and it could continue to climb towards the $5,400 and $5,450 levels.
Bitcoin price is slowly grinding higher towards $5,450 against the US Dollar. BTC remains in an uptrend and it is likely to climb towards the $5,500 level in the coming sessions.
Bitcoin Price Analysis
In the past three sessions, there was a steady rise above $5,280 in bitcoin price against the US Dollar. The BTC/USD pair gained traction above the $5,300 resistance and settled above the 100 hourly simple moving average. The price spiked broke the $5,340 level and traded as high as $5,359. Recently, it corrected lower below the $5,320 level, and the 23.6% Fib retracement level of the upward move from the $5,197 swing low to $5,359 high.
The price even traded below the $5,300 level, but the $5,280 support acted as a strong support. Besides, the 50% Fib retracement level of the upward move from the $5,197 swing low to $5,359 high acted as a support. More importantly, there are two bullish trend lines formed with support near $5,320 and $5,280 on the hourly chart of the BTC/USD pair. On the downside, there are many supports near $5,280 and $5,250. If there are extended losses, the price may retest the $5,200 support. The 100 hourly SMA is also close to $5,200 to hold losses.
On the upside, a clear break above the $5,360 level may open the gates for a push towards the $5,400 level. The next key resistance is near the $5,450 level, where sellers may appear. The current price action is positive and, therefore suggests more gains above $5,360. If there is a downside correction, the bulls are likely to protect $5,280 or $5,250.
Looking at the chart, bitcoin price is showing positive signs above $5,280. There might be a couple of swing moves in the short term, but the price is likely to surpass the $5,360 swing high. As a result, the main stop for the bulls this week could be $5,450 or even $5,500. Conversely, a close below $5,200 and the 100 hourly SMA is likely to negate the current bullish view.
Technical indicators:
Hourly MACD – The MACD is slowly moving back in the bullish zone, with flat signals.
Hourly RSI (Relative Strength Index) – The RSI for BTC/USD is now above the 50 level and testing 60.
Major Support Levels – $5,280 followed by $5,250.
Major Resistance Levels – $5,360, $5,400 and $5,450.