Reason to trust
How Our News is Made
Strict editorial policy that focuses on accuracy, relevance, and impartiality
Ad discliamer
Morbi pretium leo et nisl aliquam mollis. Quisque arcu lorem, ultricies quis pellentesque nec, ullamcorper eu odio.
- Ripple price started a decent upward move and broke the $0.2960 resistance against the US dollar.
- Both bitcoin and Ethereum recovered and gained more than 2.5%.
- There is a short term breakout pattern forming with resistance near $0.3085 on the hourly chart of the XRP/USD pair (data source from Kraken).
- The pair could continue higher and it is likely to test the $0.3175 and $0.3200 resistance levels.
Ripple price starts a decent rebound against the US Dollar, along with bitcoin. XRP is currently trading with a positive bias and looks set to test the $0.3200 barrier.
Ripple Price Analysis
After a major drop, ripple price formed a strong support above the $0.2850 level against the US Dollar. The XRP/USD pair slowly climbed above the $0.2880 and $0.2900 resistance levels. Later, there was a close above the $0.2920 resistance level and the 100 hourly simple moving average. Besides, the price cleared the 61.8% Fib retracement level of the drop from the $0.3082 high to $0.2798 low. It opened the doors for more gains and the price spiked above the $0.3080 level.
A high was formed near the $0.3088 level and the price is currently consolidating gains. Furthermore, there is a short term breakout pattern forming with resistance near $0.3085 on the hourly chart of the XRP/USD pair. Below the triangle support, the 23.6% Fib retracement level of the recent wave from the $0.2836 low to $0.3088 high might act as a support. The next key support is near the $0.2960 level. The 50% Fib retracement level of the recent wave from the $0.2836 low to $0.3088 high is also near the $0.2960 level.
On the upside, a break above the $0.3085 and $0.3100 levels is likely to open the doors for more gains. The next key resistance is near the $0.3160 and $0.3175 levels. Above these, the price is likely to grind further higher towards the $0.3200 resistance level.
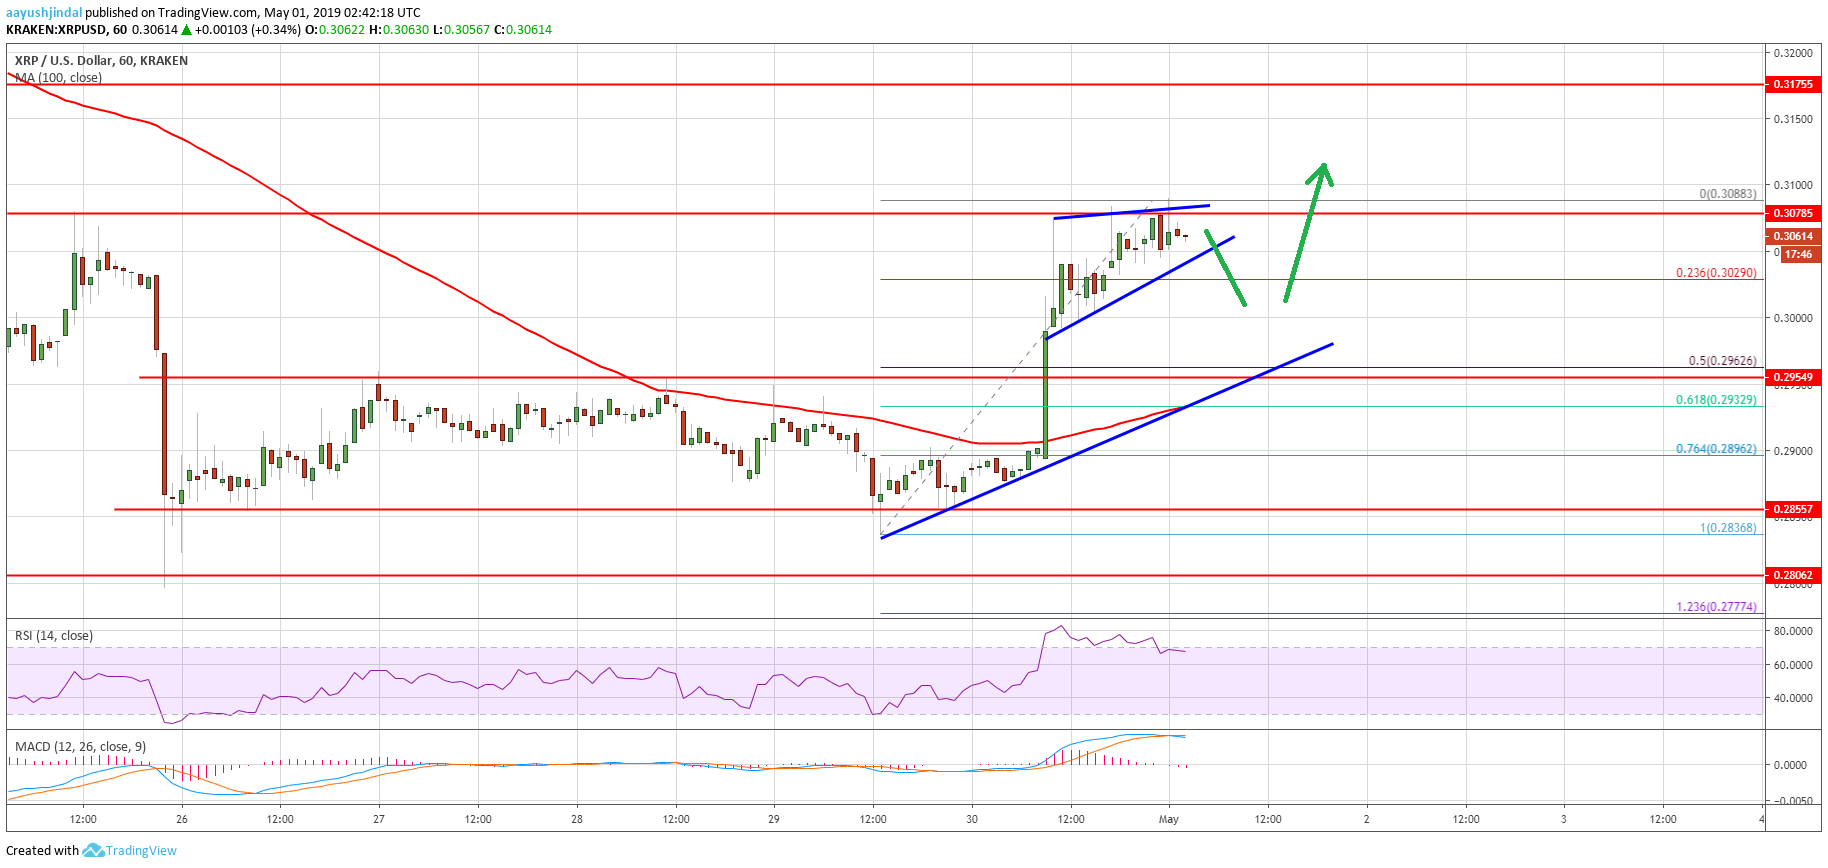
Looking at the chart, ripple price clearly climbed higher and it is currently consolidating gains above $0.3000. In the short term, there could be a downside correction towards $0.3000 or $0.2960. There is also a connecting bullish trend line in place with support near the $0.2960 level on the same chart. Therefore, dips remain well supported close to the $0.2960 level. To the topside, the main target for the bulls could be $0.3200 or even the $0.3220 pivot level.
Technical Indicators
Hourly MACD – The MACD for XRP/USD is slowly moving back in the bearish zone.
Hourly RSI (Relative Strength Index) – The RSI for XRP/USD is currently correcting lower towards the 60 and 55 levels.
Major Support Levels – $0.3020, $0.3000 and $0.2960.
Major Resistance Levels – $0.3085, $0.3160 and $0.3175.