Reason to trust

How Our News is Made
Strict editorial policy that focuses on accuracy, relevance, and impartiality
Ad discliamer
Morbi pretium leo et nisl aliquam mollis. Quisque arcu lorem, ultricies quis pellentesque nec, ullamcorper eu odio.
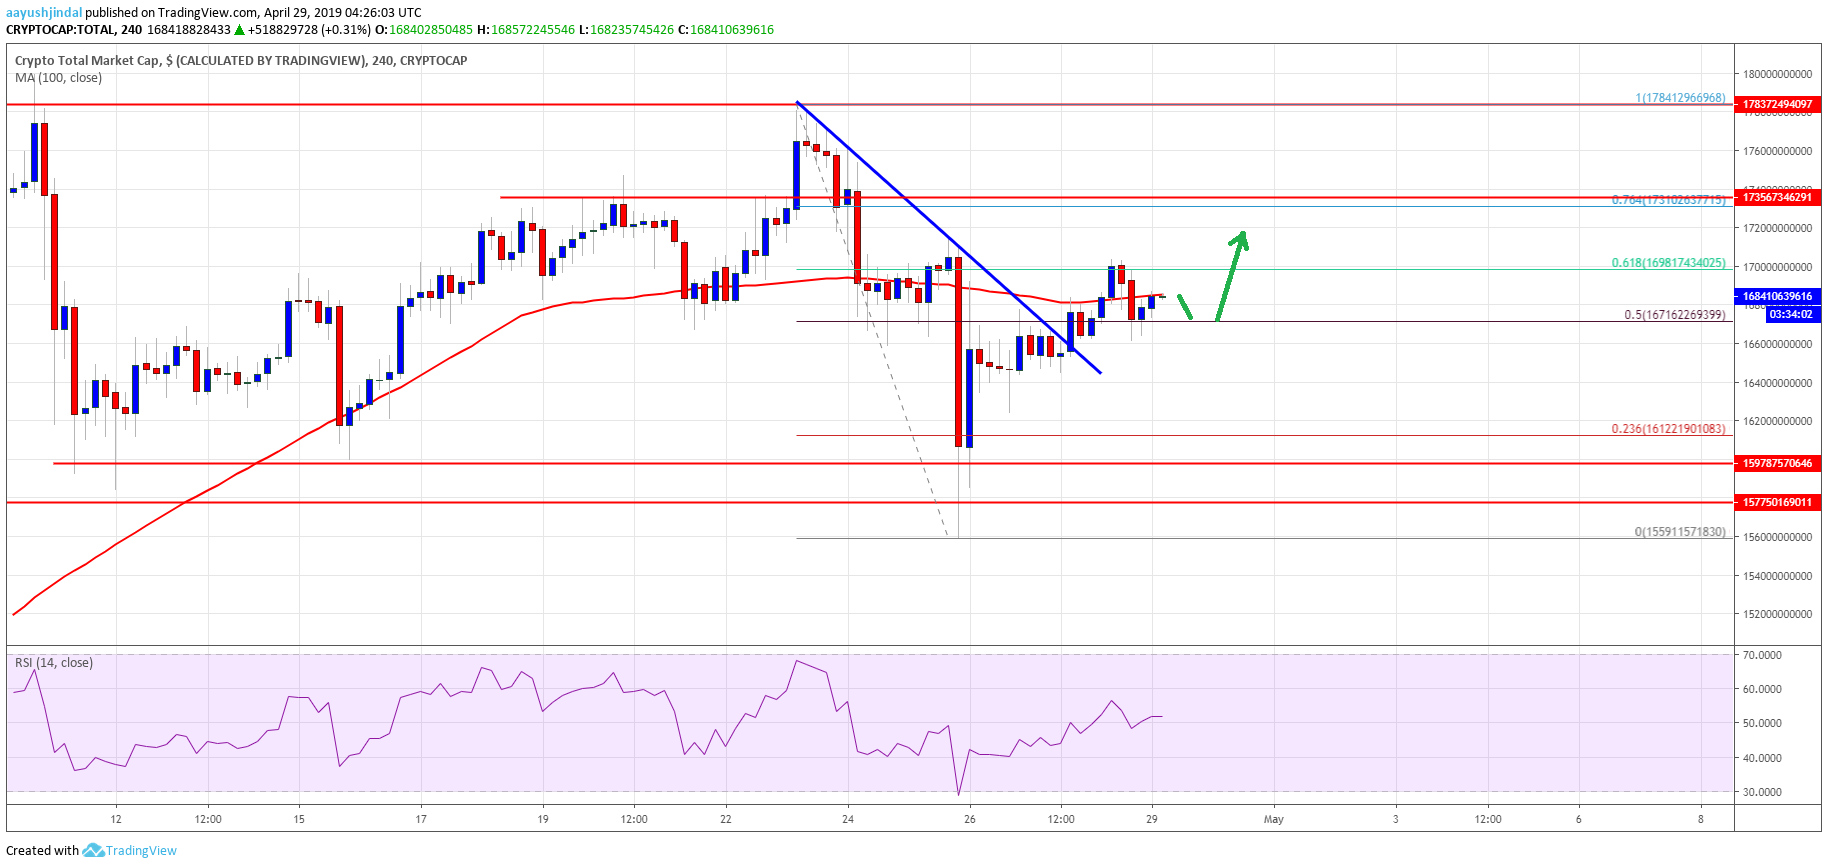
- The total crypto market cap broke a major bearish trend line near the $166.5B resistance.
- Bitcoin cash price is still struggling and it recently broke the $260 support.
- Tron (TRX) is currently consolidating losses above the $0.0230 support level.
- Cardano (ADA) broke the $0.0700 support level and it could now test $0.0650.
- IOTA (MIOTA) climbed higher sharply by more than 10% and broke the $0.3000 resistance.
The crypto market is slowly moving higher, driven by bullish moves in bitcoin (BTC). IOTA performed really well, while Ethereum (ETH), tron, ripple, LTC, and cardano remain under pressure.
Bitcoin Cash Price Analysis
Bitcoin cash price settled below the $280 support level against the US dollar. The BCH/USD pair attempted an upside correction, but it failed to gain traction above the $275 level. As a result, there was a fresh decline and the price broke the $265 and $260 support levels.
The price even cleared the $255 level and it seems like it could test the $250 support level. On the upside, the previous supports near $260 and $262 are now likely to act as hurdles for the bulls.
Tron (TRX), ADA and IOTA Price Analysis
Tron price remained in a strong downtrend as it broke the $0.0262 and $0.0250 support levels. TRX price is currently trading well below the $0.0240 support level and it is consolidating above the $0.0230 level. The next key supports are near $0.0225 and $0.0220.
Cardano price trimmed most its gains after it broke the key $0.1000 support level. ADA price even broke the $0.0850 and $0.0700 support levels. It seems like the price is under a lot of pressure and it may continue to decline towards the $0.0600 support level. On the upside, the $0.0700 and $0.0745 levels are initial hurdles.
IOTA (MIOTA) performed really well in the past three sessions and gained more than 10%. IOTA price broke the $0.2850 and $0.3000 resistance levels to move into a positive zone. The price is currently consolidating gains and it may correct lower towards the $0.2900 level.

Looking at the total cryptocurrency market cap hourly chart, there was a steady recovery above the $165.0B resistance level. The market cap broke a major bearish trend line near the $166.5B level to move into a positive zone. It tested the 61.8% Fib retracement level of the last decline from the $178.4B high to $155.9B low. At the moment, the market cap is trading in a range and it could climb towards the $170.0B or $172.0B resistance level. The main driving force could be bitcoin since most altcoins such as Ethereum, EOS, ripple, WTC, litecoin, BCH, ICX, XMR, and XLM ae currently under a lot of pressure.


