
Reason to trust
How Our News is Made
Strict editorial policy that focuses on accuracy, relevance, and impartiality
Ad discliamer
Morbi pretium leo et nisl aliquam mollis. Quisque arcu lorem, ultricies quis pellentesque nec, ullamcorper eu odio.
- Bitcoin price rebounded above $5,100 after a massive drop towards $4,900 against the US Dollar.
- The price seems to be facing a strong resistance near the $5,200 and $5,220 levels.
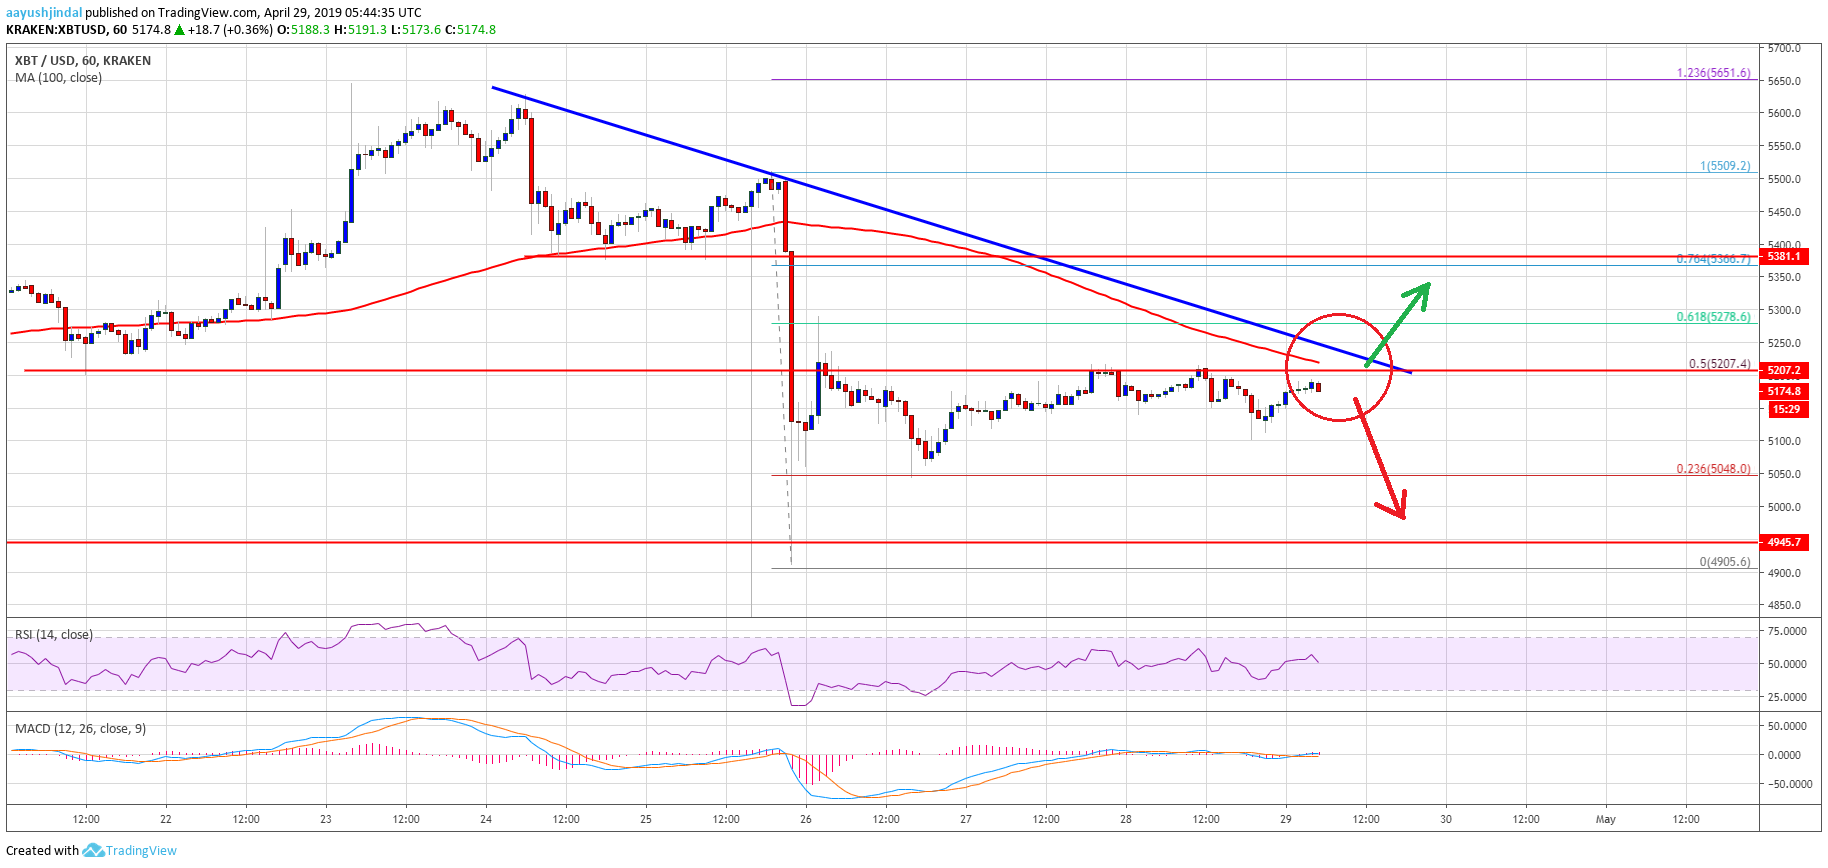
- There is a major bearish trend line in place with resistance near $5,230 on the hourly chart of the BTC/USD pair (data feed from Kraken).
- The pair could either rally above the $5,250 resistance or start a fresh decline in the near term.
Bitcoin price is facing a significant resistance against the US Dollar. BTC is likely to climb sharply if it settles above $5,250 and the 100 hourly simple moving average.
Bitcoin Price Analysis
This past week, there was a sharp drop in bitcoin price below the $5,200 support against the US Dollar. The BTC/USD pair even spiked below the $5,000 support level and formed a swing low above $4,900. Later, the price started a slow and steady recovery above the $5,000 and $5,050 resistance levels. The bulls even pushed the price above the $5,100 resistance and the 23.6% Fib retracement level of the last slide from the $5,509 high to $4,905 low.
It opened the doors for more gains above the $5,150 level, but the price struggled to clear the $5,200 and $5,220 resistance levels. It seems like the 50% Fib retracement level of the last slide from the $5,509 high to $4,905 low is acting as a hurdle. Besides, the 100 hourly simple moving average is also acting as a key resistance near $5,220. More importantly, there is a major bearish trend line forming with resistance near $5,230 on the hourly chart of the BTC/USD pair.
Therefore, the price must break the $5,220 resistance, the trend line, and the 100 hourly SMA. A successful close above $5,250 is likely to start a decent upward move towards the $5,300 level. The next major resistance for the bulls is near the $5,380 level. On the other hand, if there is no upside break, the price may decline below $5,150. An initial support is near the $5,100 level, below which the next stop could be $5,050.
Looking at the chart, bitcoin price is clearly trading near a crucial juncture below $5,220 and $5,250. If the bulls gain control above $5,220 and $5,250, there could be a decent extension towards the $5,380 resistance level. Conversely, a continuous struggle to clear $5,250 is likely to start a fresh decrease towards the $5,100 or $5,050 level in the near term.
Technical indicators:
Hourly MACD – The MACD is slowly moving in the bullish zone, with a few positive signs.
Hourly RSI (Relative Strength Index) – The RSI for BTC/USD managed to move back above the 50 level.
Major Support Levels – $5,150 followed by $5,100.
Major Resistance Levels – $5,200, $5,220 and $5,250.