
Reason to trust
How Our News is Made
Strict editorial policy that focuses on accuracy, relevance, and impartiality
Ad discliamer
Morbi pretium leo et nisl aliquam mollis. Quisque arcu lorem, ultricies quis pellentesque nec, ullamcorper eu odio.
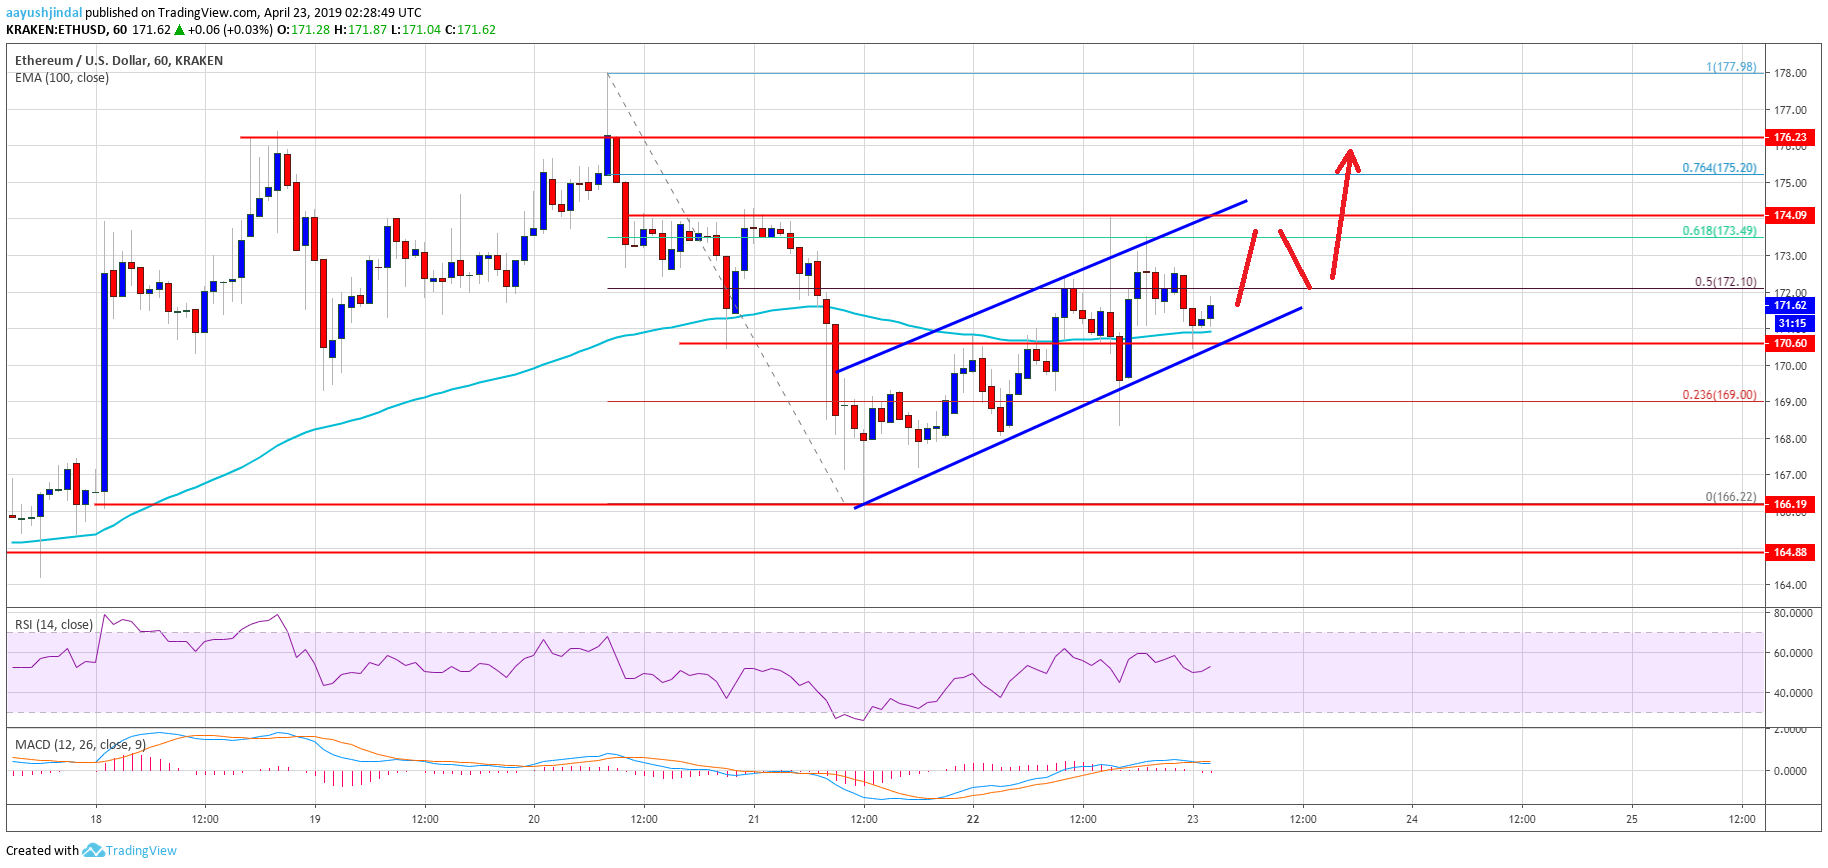
- ETH price corrected lower and tested the $165-166 support area against the US Dollar.
- The price bounced back and recently broke the $169 and $170 resistance levels.
- There is a key ascending channel in place with support at $170 on the hourly chart of ETH/USD (data feed via Kraken).
- The pair is likely to accelerate higher and it could soon break the $175 and $176 resistance levels.
Ethereum price is holding the ground versus the US Dollar and bitcoin. ETH seems to be following a bullish path and it may accelerate above the $175 resistance in the near term.
Ethereum Price Analysis
Recently, we saw a sharp downside correction in Ethereum price from the $178 swing high against the US Dollar. The ETH/USD pair broke the $170 support level and traded close to the $165 support area. A swing low was formed at $166 and the price bounced back in the past three sessions. There was a break above the $169 and $170 resistance levels, pushing the price back in a positive zone. The price even settled above the $170 level and the 100 hourly simple moving average.
The bulls pushed the price above the 50% Fib retracement level of the last decline from the $178 high to $166 low. The price traded close to the $174 level, where sellers emerged. Besides, the price tested the 61.8% Fib retracement level of the last decline from the $178 high to $166 low. At the moment, there is a key ascending channel in place with support at $170 on the hourly chart of ETH/USD. The pair seems to be trading nicely above the $170 level and the 100 hourly SMA.
As long as the price is above the $169 and $170 support levels, there could be more gains in the near term. On the upside, a break above the $175 resistance is likely to open the doors for more gains. The next stop for the bulls could be $180, where sellers might appear. On the other hand, a break below the $169 pivot level may push the price back towards the $166 level.
Looking at the chart, Ethereum price is trading with a positive bias above the $169 and $170 support levels. The current price action indicates an extended upward move above the $174 level. Once buyers gain pace above $175, there could be a sharp rally towards the $180 and $182 levels.
ETH Technical Indicators
Hourly MACD – The MACD for ETH/USD is about to gain strength in the bullish zone, with positive signs.
Hourly RSI – The RSI for ETH/USD is currently placed nicely above the 50 level, with a bullish angle.
Major Support Level – $169
Major Resistance Level – $175