Reason to trust
How Our News is Made
Strict editorial policy that focuses on accuracy, relevance, and impartiality
Ad discliamer
Morbi pretium leo et nisl aliquam mollis. Quisque arcu lorem, ultricies quis pellentesque nec, ullamcorper eu odio.
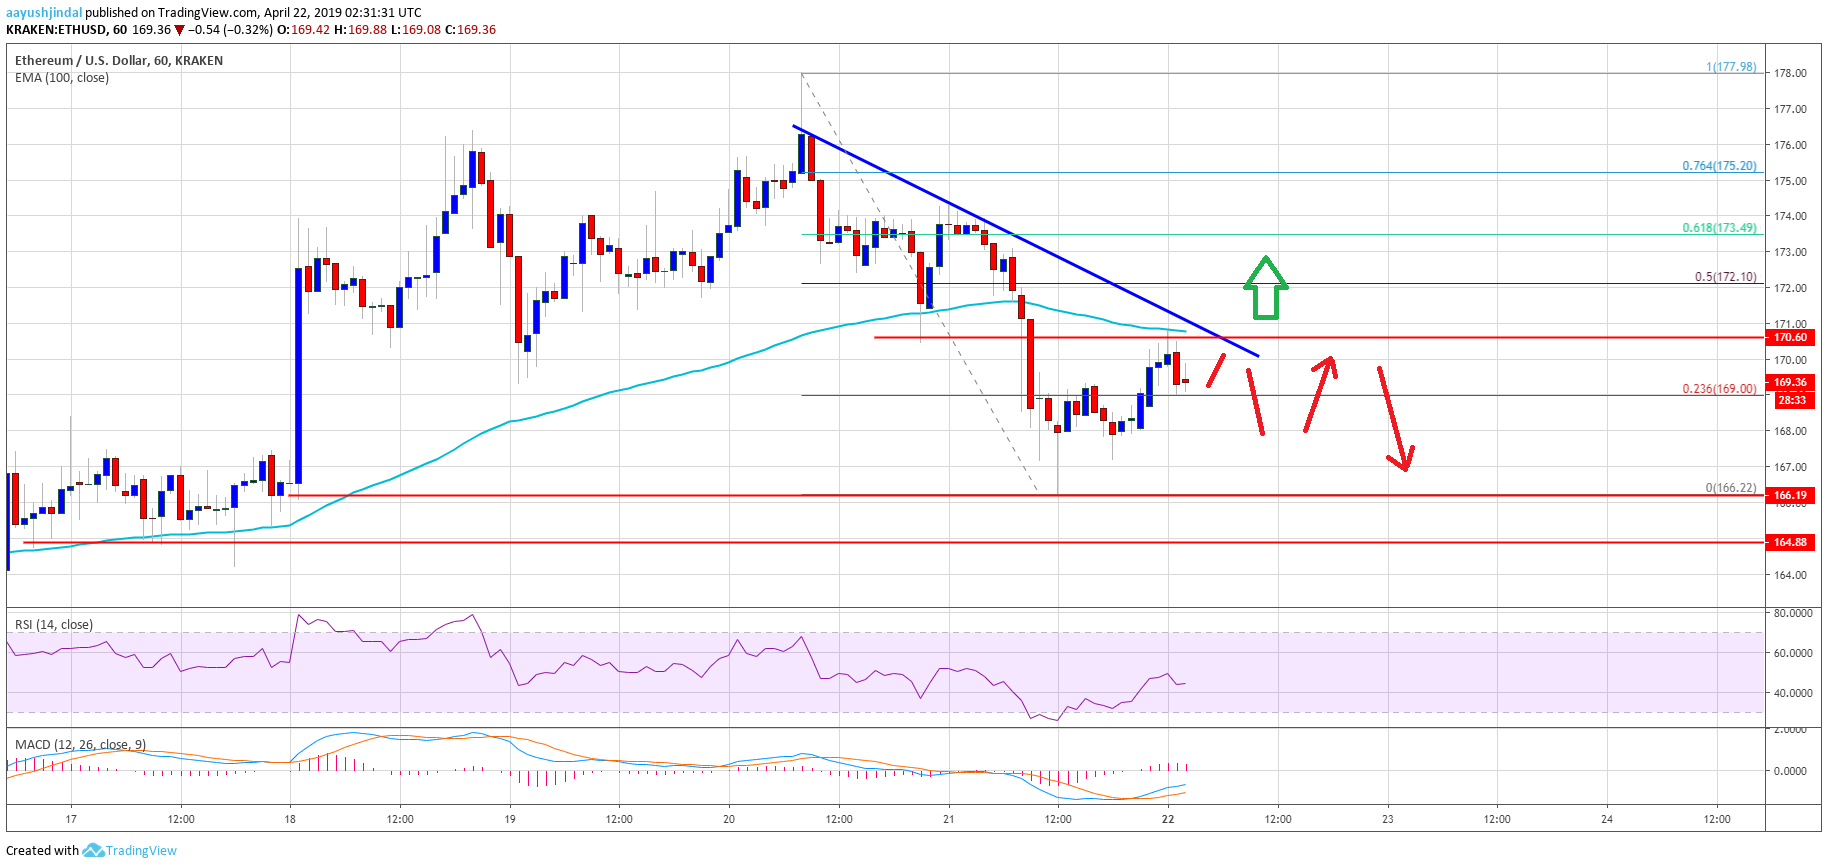
- ETH price traded above the $174 and $175 resistance levels before it faced sellers against the US Dollar.
- The price traded towards the $178 level and later started a downside correction below $172.
- There is a major bearish trend line in place with resistance at $171 on the hourly chart of ETH/USD (data feed via Kraken).
- The pair could either climb back above $171 or correct lower further towards the $166 support area.
Ethereum price started a downside correction versus the US Dollar, but remained flat against bitcoin. ETH could revisit the $166 support, but it remains well bid on the downside.
Ethereum Price Analysis
There was a decent upward move above the $170 resistance in Ethereum price against the US Dollar. The ETH/USD pair surpassed the $174 and $175 resistance levels to move into a positive zone. However, the price failed to retain bullish momentum above the $178 level. It formed a high just below $178 and later declined below the $175 level. There was a break below the $170 support and the 100 hourly simple moving average. The price traded close the $166 level, where buyers took a stand.
Recently, the price recovered above the $168 level and the 23.6% Fib retracement level of the recent drop from the $178 swing high to $166 low. However, the $170 area and the 100 hourly simple moving average is acting as a strong resistance. There is also a major bearish trend line in place with resistance at $171 on the hourly chart of ETH/USD. Above the trend line, the next resistance is near $172 and the 50% Fib retracement level of the recent drop from the $178 swing high to $166 low.
On the downside, an initial support is at $168, below which the price may revisit the $166 support. Any further losses are very unlikely and it seems like the price could bounce back above $171 and $172. The main resistance is at $175, above which the price could rally towards $180 and $182.
Looking at the chart, Ethereum price seems to be correcting lower towards the $166 or $165 support. However, the overall bias is positive and the price could bounce back once it completes the current correction near $165. On the upside, a break above $172 is needed for a fresh increase towards the $178 level. Above $178, the price could break the $180 resistance.
ETH Technical Indicators
Hourly MACD – The MACD for ETH/USD is slowly moving in the bullish zone, with a few positive signs.
Hourly RSI – The RSI for ETH/USD failed to stay above the 50 level and it is currently heading to 40.
Major Support Level – $166
Major Resistance Level – $172