Reason to trust
How Our News is Made
Strict editorial policy that focuses on accuracy, relevance, and impartiality
Ad discliamer
Morbi pretium leo et nisl aliquam mollis. Quisque arcu lorem, ultricies quis pellentesque nec, ullamcorper eu odio.
- ETH price remains well supported on the downside near the $170 area against the US Dollar.
- The price settled in a positive zone above the $165 and $169 resistance levels.
- There is a major bearish trend line formed with resistance at $176 on the 4-hours chart of ETH/USD (data feed via Kraken).
- The pair could start a significant rally once there is a break above the $176 and $180 resistance levels.
Ethereum price gained traction from key supports versus the US Dollar and bitcoin. ETH is currently placed nicely above $170 and it could break $180 to climb sharply towards $200.
Ethereum Price Weekly Analysis
This past week, Ethereum price dipped further to test the $155 support area against the US Dollar. The ETH/USD pair traded close to the $155 support, which acted as a strong buy zone. The pair started a solid rebound above the $160 and $165 resistance levels. There was a break above the 50% Fib retracement level of the last decline from the $188 high to $155 low. Moreover, there was a close above the $162 pivot level and the 100 simple moving average (4-hours).
Finally, there was a break above the $169 and $170 resistance levels. It opened the doors for more gains and the price tested the $176-178 resistance area. The 61.8% Fib retracement level of the last decline from the $188 high to $155 low is also acting as a resistance. There is also a major bearish trend line formed with resistance at $176 on the 4-hours chart of ETH/USD. Therefore, the pair must break the $176 resistance area to climb further higher in the near term.
A successful close above the $176 and $180 resistance level may set the pace for more gains. The next resistance is at $188, above which the price could rally towards the $200 level. On the downside, the main support is near the $170 level. Below $170, the price is likely to decline further towards the $162 support and the 100 simple moving average (4-hours).
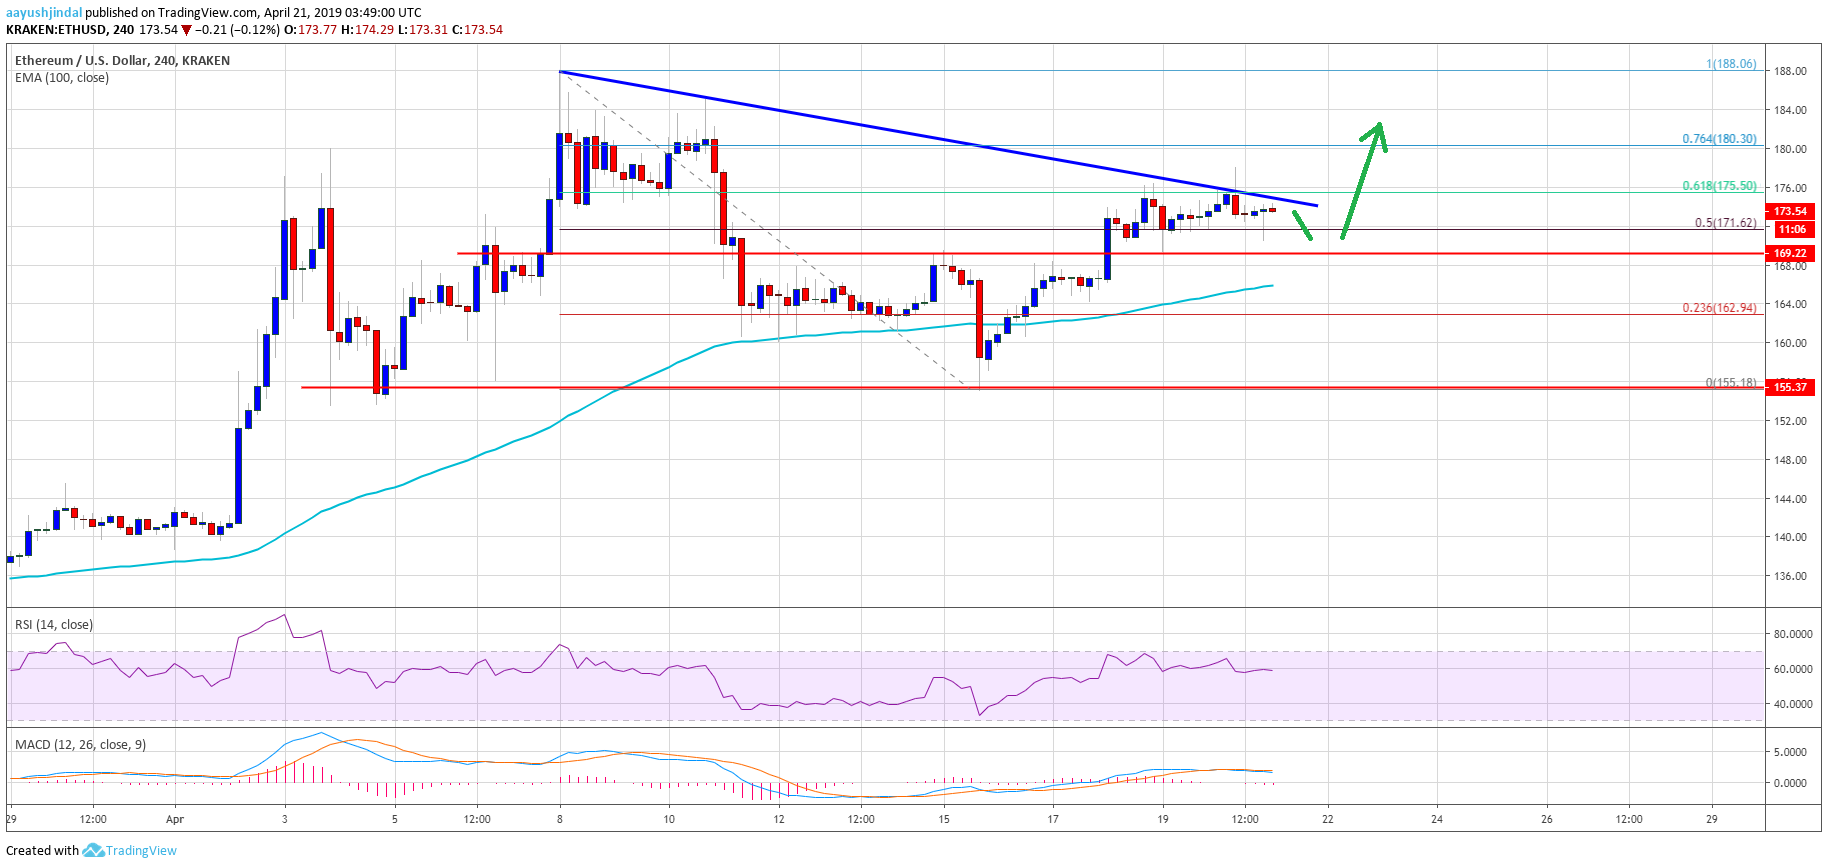
The above chart indicates that Ethereum seems to be testing a significant resistance near the $176 level. If buyers successfully gain traction above $176, there are chances of more upsides above the $180 and $188 level. Conversely, there is a risk of a downside reaction below the $170 support level. However, there are many supports below $170 near the $162 level.
Technical Indicators
4 hours MACD – The MACD for ETH/USD is about to climb back in the bullish zone.
4 hours RSI – The RSI for ETH/USD is currently well above the 50 level, with a flat structure near 60.
Major Support Level – $170
Major Resistance Level – $176