Reason to trust
How Our News is Made
Strict editorial policy that focuses on accuracy, relevance, and impartiality
Ad discliamer
Morbi pretium leo et nisl aliquam mollis. Quisque arcu lorem, ultricies quis pellentesque nec, ullamcorper eu odio.
- Ripple price climbed sharply towards the $0.3500 resistance before sellers appeared against the US dollar.
- The price formed a high near $0.3489 and recently corrected lower sharply below $0.3400.
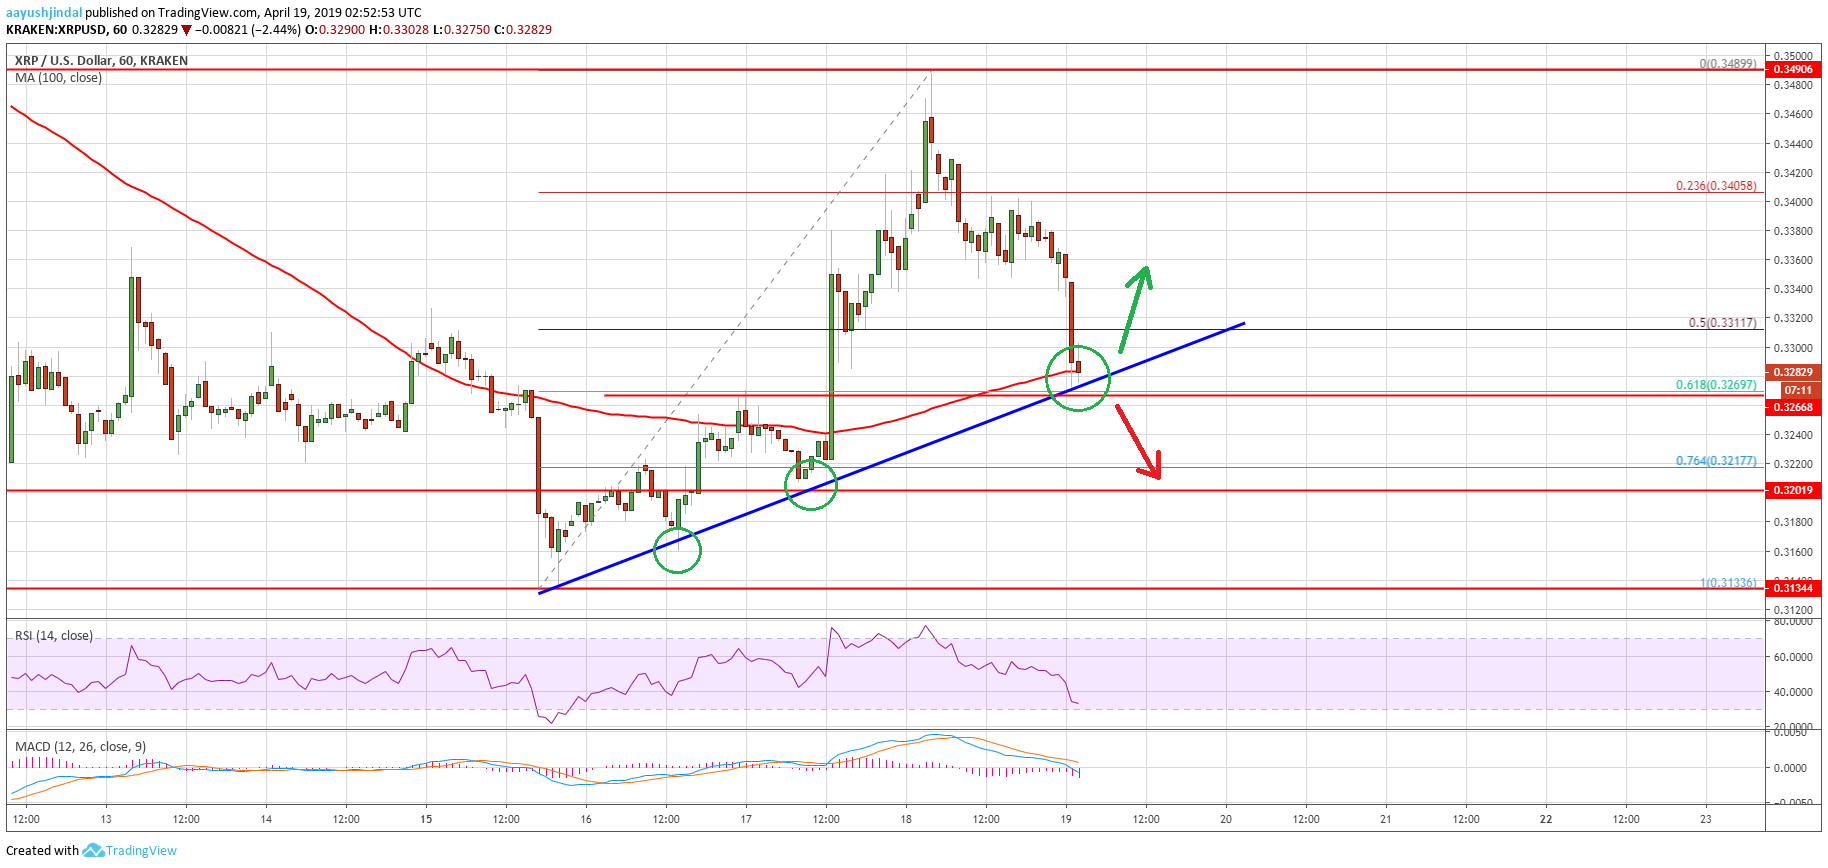
- There is a key bullish trend line formed with support at $0.3270 on the hourly chart of the XRP/USD pair (data source from Kraken).
- The pair must stay above $0.3260 and the 100 hourly SMA to bounce back in the near term.
Ripple price gained traction before starting a downside correction against the US Dollar and bitcoin. XRP could bounce back as long as it is above the $0.3260 support area.
Ripple Price Analysis
Yesterday, there was a strong upward move initiated after ripple price broke the $0.3250 resistance against the US Dollar. The XRP/USD pair gained bullish momentum and traded above the $0.3300 and $0.3400 resistance levels. The upward move was such that the price traded towards the $0.3500 resistance area, where sellers appeared. A new weekly high was formed at $0.3489 before the price started a major downside correction. It broke the $0.3400 support and the 23.6% Fib retracement level of the last upside from the $0.3133 low to $0.3489 high.
The decline was such that the price even broke the $0.3320 support area, and the 50% Fib retracement level of the last upside from the $0.3133 low to $0.3489 high. However, the $0.3270-0.3280 area acted as a strong support. There is also a key bullish trend line formed with support at $0.3270 on the hourly chart of the XRP/USD pair. Besides, the 100 hourly simple moving average, currently near $0.3270 is also acting as a strong support. The price also tested the 61.8% Fib retracement level of the last upside from the $0.3133 low to $0.3489 high.
Therefore, there are chances of a fresh increase above the $0.3320 and $0.3350 levels in the near term. If buyers gain pace above the $0.3350 level, the price is likely to climb back above $0.3400. On the other hand, if there is a downside break below $0.3260 and the 100 hourly SMA, the price could move back in a bearish zone.
Looking at the chart, ripple price seems to be trading near key supports near $0.3260 and $0.3270. As long as the bulls are protecting the $0.3260 support, there are chances of a strong bullish reaction above $0.3350 in the coming sessions.
Technical Indicators
Hourly MACD – The MACD for XRP/USD moved into the bearish zone and it is slowly gaining pace.
Hourly RSI (Relative Strength Index) – The RSI for XRP/USD declined sharply below the 50 level and it is currently below 40.
Major Support Levels – $0.3270, $0.3260 and $0.3220.
Major Resistance Levels – $0.3320, $0.3350 and $0.3400.