
Reason to trust
How Our News is Made
Strict editorial policy that focuses on accuracy, relevance, and impartiality
Ad discliamer
Morbi pretium leo et nisl aliquam mollis. Quisque arcu lorem, ultricies quis pellentesque nec, ullamcorper eu odio.
- Bitcoin price struggled to break the $5,190-5,200 resistance area and declined against the US Dollar.
- The price revisited the $4,940 support area and recently rebounded above $5,000.
- There is a crucial bearish trend line forming with resistance at $5,110 on the hourly chart of the BTC/USD pair (data feed from Kraken).
- The pair could struggle in the short term, but bulls remain in control above $4,900.
Bitcoin price is showing a few signs of weakness against the US Dollar. However, BTC bulls are likely to protect dips near the $4,940 and $4,900 support levels in the near term.
Bitcoin Price Analysis
Yesterday, we saw a steady rise from the $4,940 support in bitcoin price against the US Dollar. The BTC/USD pair climbed above the $5,100 and $5,160 resistance levels. There was also a break above the $5,180 level, but the price struggled near the $5,190 resistance area (the previous support). Besides, it failed to surpass the 50% Fib retracement level of the last slide from the $5,465 high to $4,920 low. There was a topping pattern formed and the price declined below the $5,100 and $5,000 support levels.
It revisited the $4,940 support area and traded as low as $4,943. Recently, it rebounded higher and traded above the $5,000 resistance. Besides, bulls pushed the price above the $5,050 level and the 50% Fib retracement level of the recent drop from the $5,190 high to $4,943 low. However, the price is facing a strong resistance near the $5,090 level and the 100 hourly simple moving average. Besides, the 61.8% Fib retracement level of the recent drop from the $5,190 high to $4,943 low is also a hurdle.
More importantly, there is a crucial bearish trend line forming with resistance at $5,110 on the hourly chart of the BTC/USD pair. Above the trend line, the main resistance for bitcoin buyers is near the $5,190-5,200 zone. Therefore, it won’t be easy for bulls to gain traction above the $5,100 resistance in the short term.
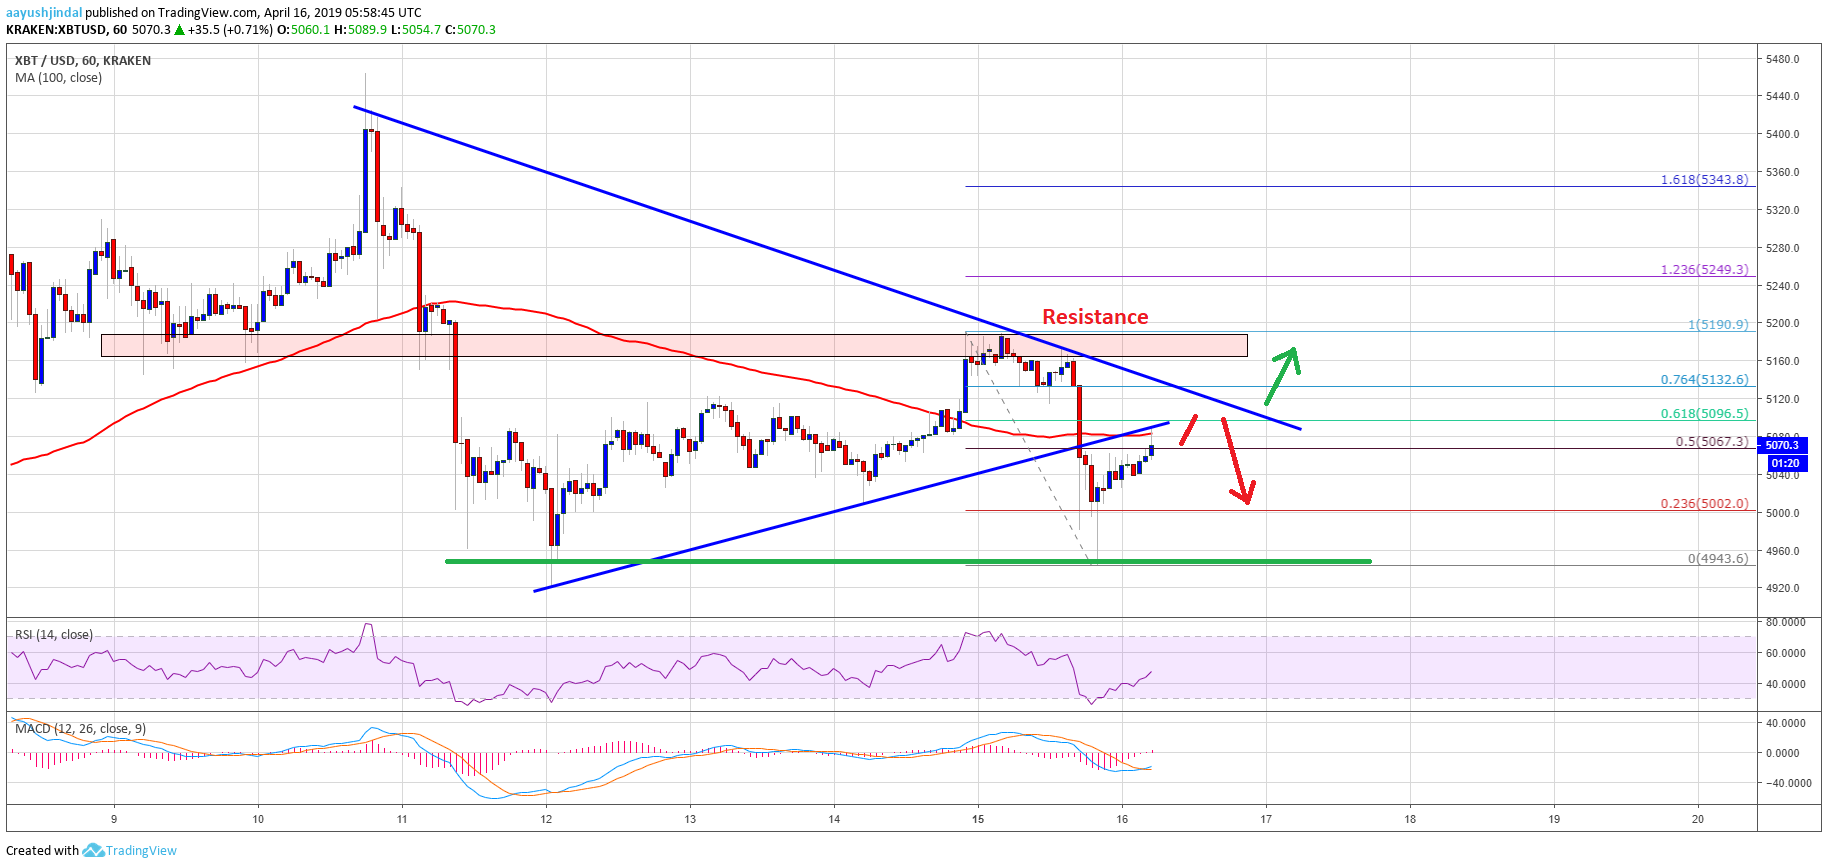
Looking at the chart, bitcoin price might face offers near the $5,100 and $5,110 levels. If it breaks the $5,110 resistance, it may retest the $5,200 resistance zone. If not, there is a chance of another downside push towards the $4,940, $4,920 and $4,900 support levels. A significant decline below $4,900 is very unlikely and bulls could buy big if there is a dip towards $4,900 or even $4,850.
Technical indicators:
Hourly MACD – The MACD is slowly moving back in the bullish zone.
Hourly RSI (Relative Strength Index) – The RSI for BTC/USD recovered above 40, but it is still below 50.
Major Support Levels – $5,000 followed by $4,940.
Major Resistance Levels – $5,090, $5,110 and $5,190.


