
Reason to trust
How Our News is Made
Strict editorial policy that focuses on accuracy, relevance, and impartiality
Ad discliamer
Morbi pretium leo et nisl aliquam mollis. Quisque arcu lorem, ultricies quis pellentesque nec, ullamcorper eu odio.
- Ripple price seems to be struggling near the $0.3700 and $0.3740 resistances against the US dollar.
- The price corrected lower recently, but it stayed above the main support at $0.3480.
- There is a major bullish trend line forming with support near the $0.3510 on the hourly chart of the XRP/USD pair (data source from Kraken).
- The pair could either bounce back towards $0.3700 or decline below the $0.3480 support in the near term.
Ripple price is currently trading in a range against the US Dollar and bitcoin. XRP seems to be preparing for the next move either towards $0.3700 and $0.3740 or below the $0.3480 support.
Ripple Price Analysis
Recently, we saw a nice upward move above the $0.3500 level in ripple price against the US Dollar. The XRP/USD pair even broke the $0.3650 resistance and the 100 hourly simple moving average. It climbed towards the $0.3800 level, but struggled to hold gains above the $0.3740 resistance. Later, there were a couple of attempts to surpass the $0.3740 resistance, but buyers failed to gain traction. As a result, there was a downside correction below $0.3600 and the price started trading in a range.
It broke the 50% Fib retracement level of the upward move from the $0.3256 low to $0.3790 high. However, the $0.3480 support area acted as a strong support and prevented declines. There was also no break below the 61.8% Fib retracement level of the upward move from the $0.3256 low to $0.3790 high. Besides, there is a major bullish trend line forming with support near the $0.3510 on the hourly chart of the XRP/USD pair. The pair is currently trading near $0.3550 and below the 100 hourly simple moving average.
There are two possible scenarios, with the pivot level at $0.3480. The price could bounce back and revisit the $0.3700 resistance level. Besides, a convincing break above the $0.3740 resistance may open the doors for more gains. Alternatively, there might be a downside break below the trend line and the $0.3480 support. In the mentioned bearish case, the price is likely to revisit the key $0.3250 support area.
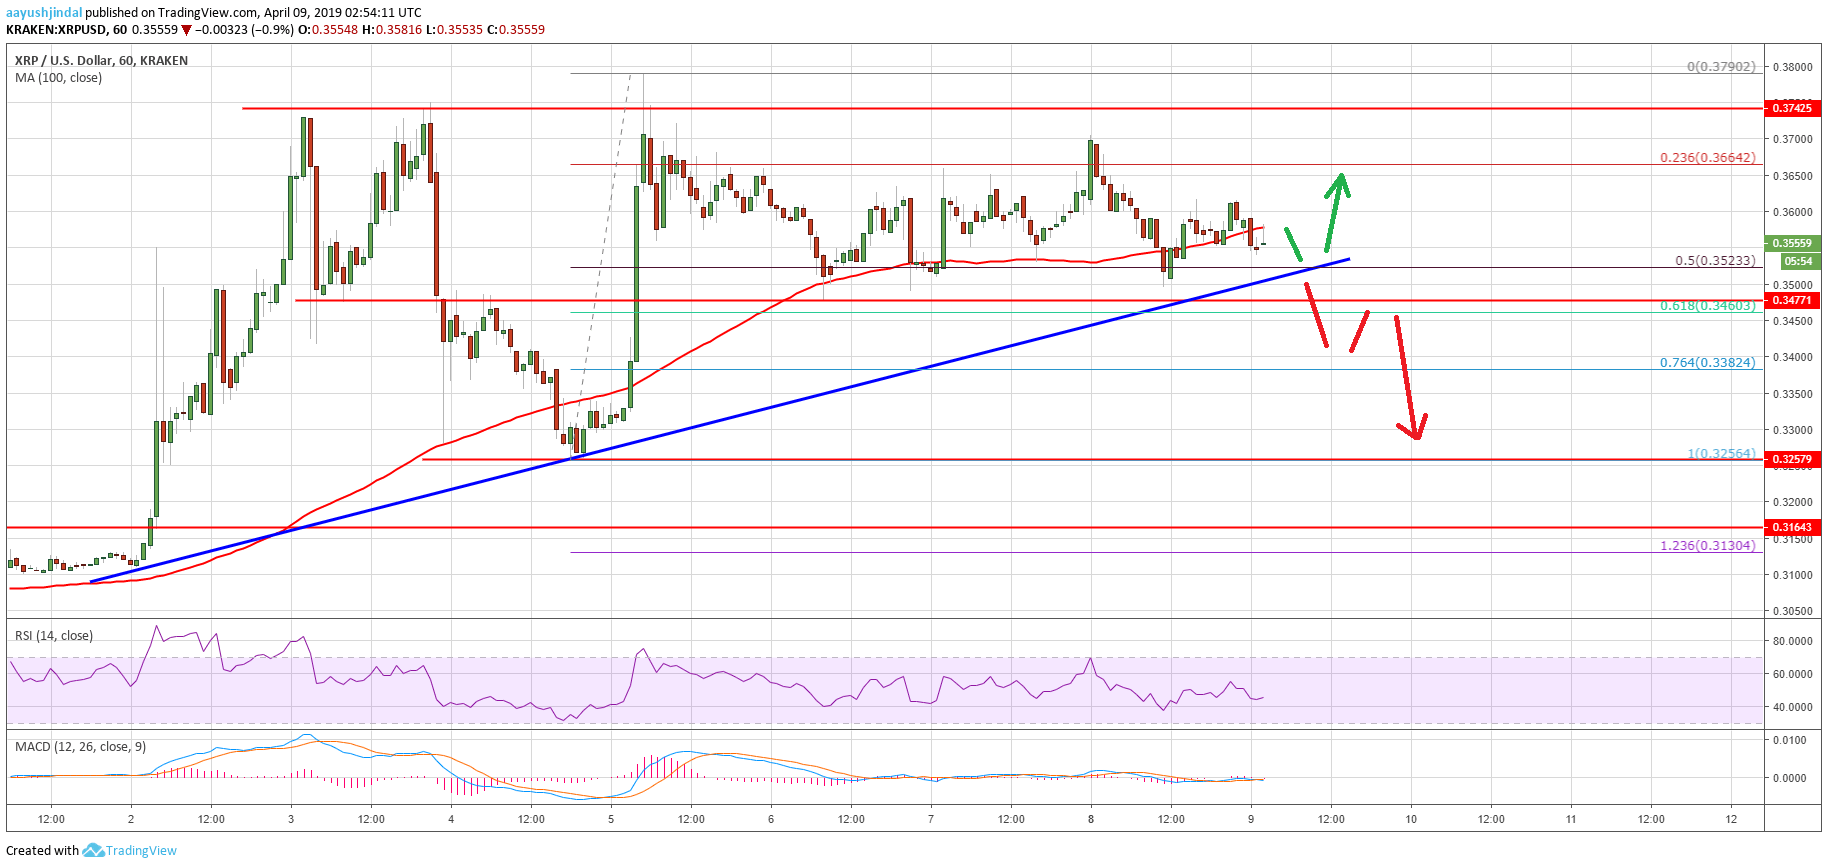
Looking at the chart, ripple price is clearly trading in a range above the $0.3480 support level. It may continue to consolidate before the next key break either above $0.3740 or towards $0.3250. In case of a downside break, the price could turn short term bearish towards $0.3250 and $0.3160.
Technical Indicators
Hourly MACD – The MACD for XRP/USD is slowly moving into the bearish zone.
Hourly RSI (Relative Strength Index) – The RSI for XRP/USD declined recently and moved below the 50 level.
Major Support Levels – $0.3510, $0.3480 and $0.3250.
Major Resistance Levels – $0.3600, $0.3700 and $0.3740.


