
Reason to trust
How Our News is Made
Strict editorial policy that focuses on accuracy, relevance, and impartiality
Ad discliamer
Morbi pretium leo et nisl aliquam mollis. Quisque arcu lorem, ultricies quis pellentesque nec, ullamcorper eu odio.
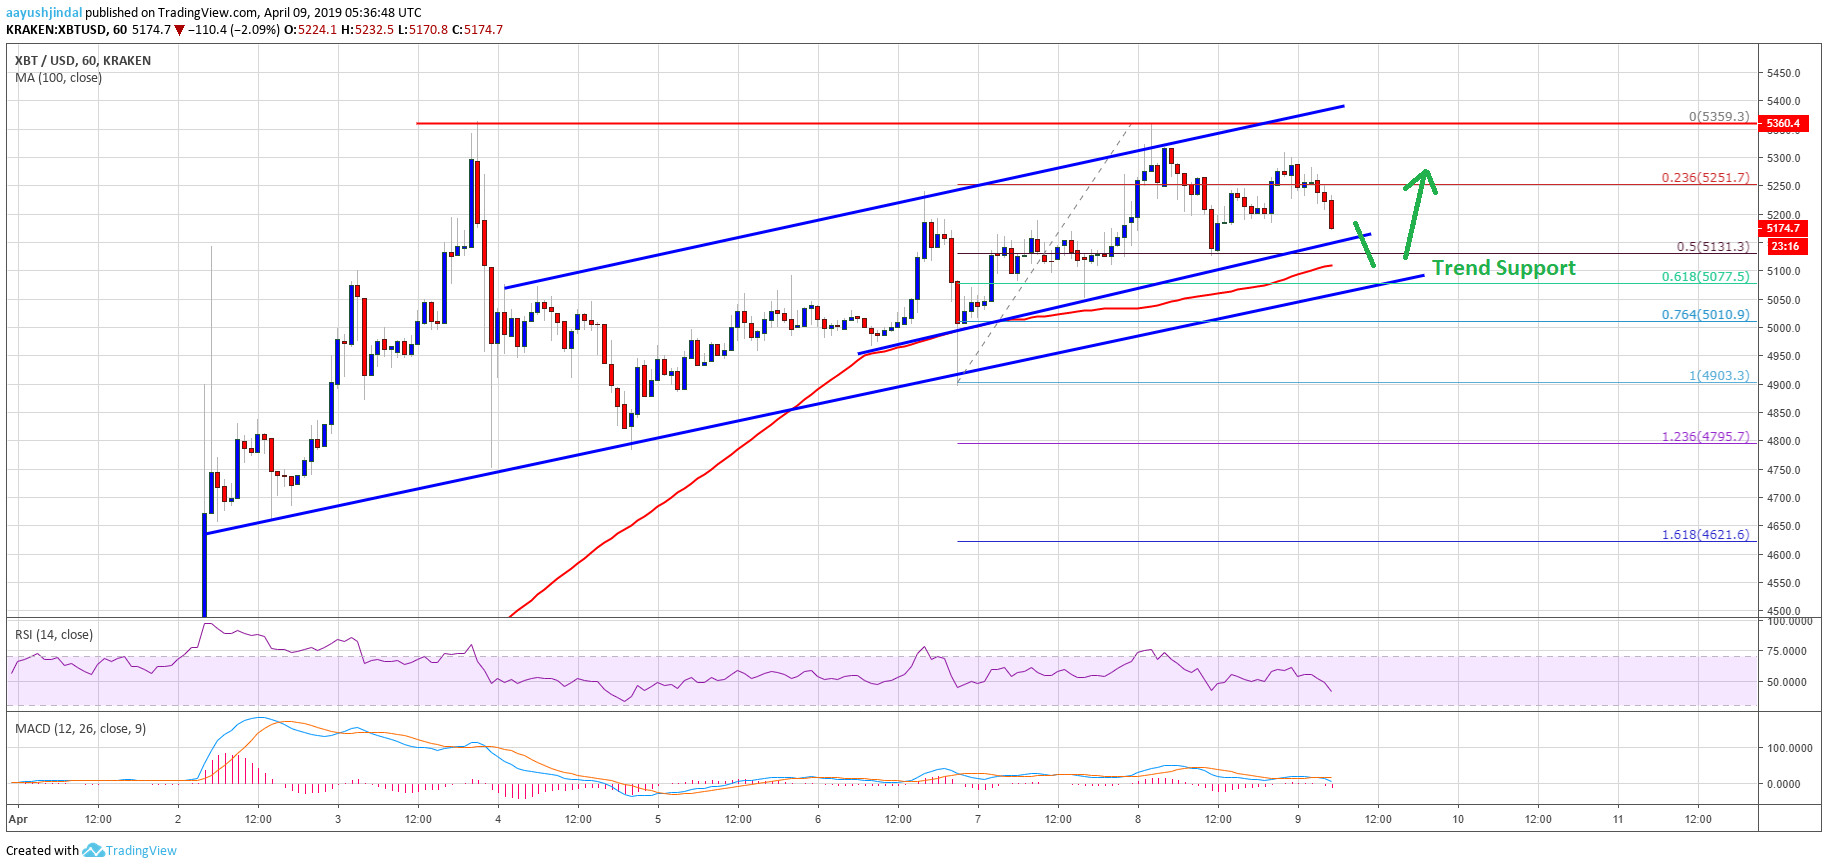
- Bitcoin price remains in a solid uptrend above the $5,070 and $5,000 supports against the US Dollar.
- The price is currently correcting lower, but it remains well supported above the $5,000 level.
- There is a crucial ascending channel forming with support at $5,075 on the hourly chart of the BTC/USD pair (data feed from Kraken).
- The pair could dip a few points towards $5,070 before it starts a fresh increase towards $5,360.
Bitcoin price is currently correcting lower below $5,251 against the US Dollar. BTC could test the $5,050-5,070 support before it bounces back towards the $5,300 and $5,360 levels.
Bitcoin Price Analysis
Recently, there was a slow and steady rise towards the $5,300 resistance in bitcoin price against the US Dollar. The BTC/USD pair broke the $5,250 resistance area, but it failed to surpass the $5,300 resistance. Earlier, the price traded as high as $5,359 and later corrected below the $5,250 level. There was a break below the 23.6% Fib retracement level of the last leg from the $4,900 swing low to $5,360 swing high. The price even traded below the $5,200 level and tested the $5,130 level.
The 50% Fib retracement level of the last leg from the $4,900 swing low to $5,360 swing high acted as a strong support. There was a fresh increase above $5,250, but the price topped near $5,300. It is currently moving lower towards a connecting bullish trend line with support at $5,150 on the hourly chart of the BTC/USD pair. Below the trend line, the 100 hourly simple moving average is positioned at $5,100. More importantly, there is a crucial ascending channel forming with support at $5,075 on the same chart.
In the short term, there could be a downside spike towards the $5,100 or $5,075 support levels. However, buyers are likely to protect more losses below the channel support and $5,050. On the upside, an initial resistance is near the $5,250 level. The next key resistance is at $5,300, above which the price could revisit the $5,360 resistance.
Looking at the chart, bitcoin price remains in a solid uptrend and it won’t be easy for bears to push the price below $5,050 or $5,000. Only a successful close below $5,000 might start a substantial downside correction. The next key support is at $4,750. On the upside, a clear break above the $5,300 and $5,360 resistances could set the tone for a push towards $5,500.
Technical indicators:
Hourly MACD – The MACD is slowly moving in the bearish zone.
Hourly RSI (Relative Strength Index) – The RSI for BTC/USD declined recently and seems to be struggling near 50.
Major Support Levels – $5,100 followed by $5,070.
Major Resistance Levels – $5,250, $5,300 and $5,360.


