Reason to trust
How Our News is Made
Strict editorial policy that focuses on accuracy, relevance, and impartiality
Ad discliamer
Morbi pretium leo et nisl aliquam mollis. Quisque arcu lorem, ultricies quis pellentesque nec, ullamcorper eu odio.
- Ripple price started a downside correction from the $0.3750 resistance area against the US dollar.
- The price declined below $0.3600 and later settled below the key $0.3480 support area.
- There is a bearish continuation pattern formed with resistance near $0.3370 on the hourly chart of the XRP/USD pair (data source from Kraken).
- The pair might dip towards the $0.3200 support area before it could bounce back in the near term.
Ripple price started a significant downside correction against the US Dollar and bitcoin. XRP could revisit the $0.3200 support, where buyers are likely to take a stand.
Ripple Price Analysis
After a solid uptrend above $0.3600, ripple price faced sellers near the $0.3740 and $0.3750 levels against the US Dollar. The XRP/USD pair started a major downside correction and traded below the $0.3600 and $0.3500 support levels. There was even a close below the $0.3400 support area. Recently, there was a short term rebound, but the price failed to surpass the $0.3480 resistance. Besides, the price failed near the 50% Fib retracement level of the drop from the $0.3748 high to $0.3280 low.
As a result, there was a fresh decline below the $0.3350 level. The price even broke the $0.3280 low and traded to a new low near the $0.3258 level. Recently, the price recovered above the $0.3300 level. There was also a break above the 23.6% Fib retracement level of the recent decline from the $0.3486 high to $0.3258 low. However, there are many hurdles for buyers on the upside near $0.3370 and $0.3380 levels. Besides, there is a bearish continuation pattern formed with resistance near $0.3370 on the hourly chart of the XRP/USD pair.
The 100 hourly simple moving average is also near the $0.3365 level. Finally, the 50% Fib retracement level of the recent decline from the $0.3486 high to $0.3258 low is at $0.3372. Therefore, if there is an upside correction, the price is likely to face a strong selling interest near $0.3370 and $0.3380.
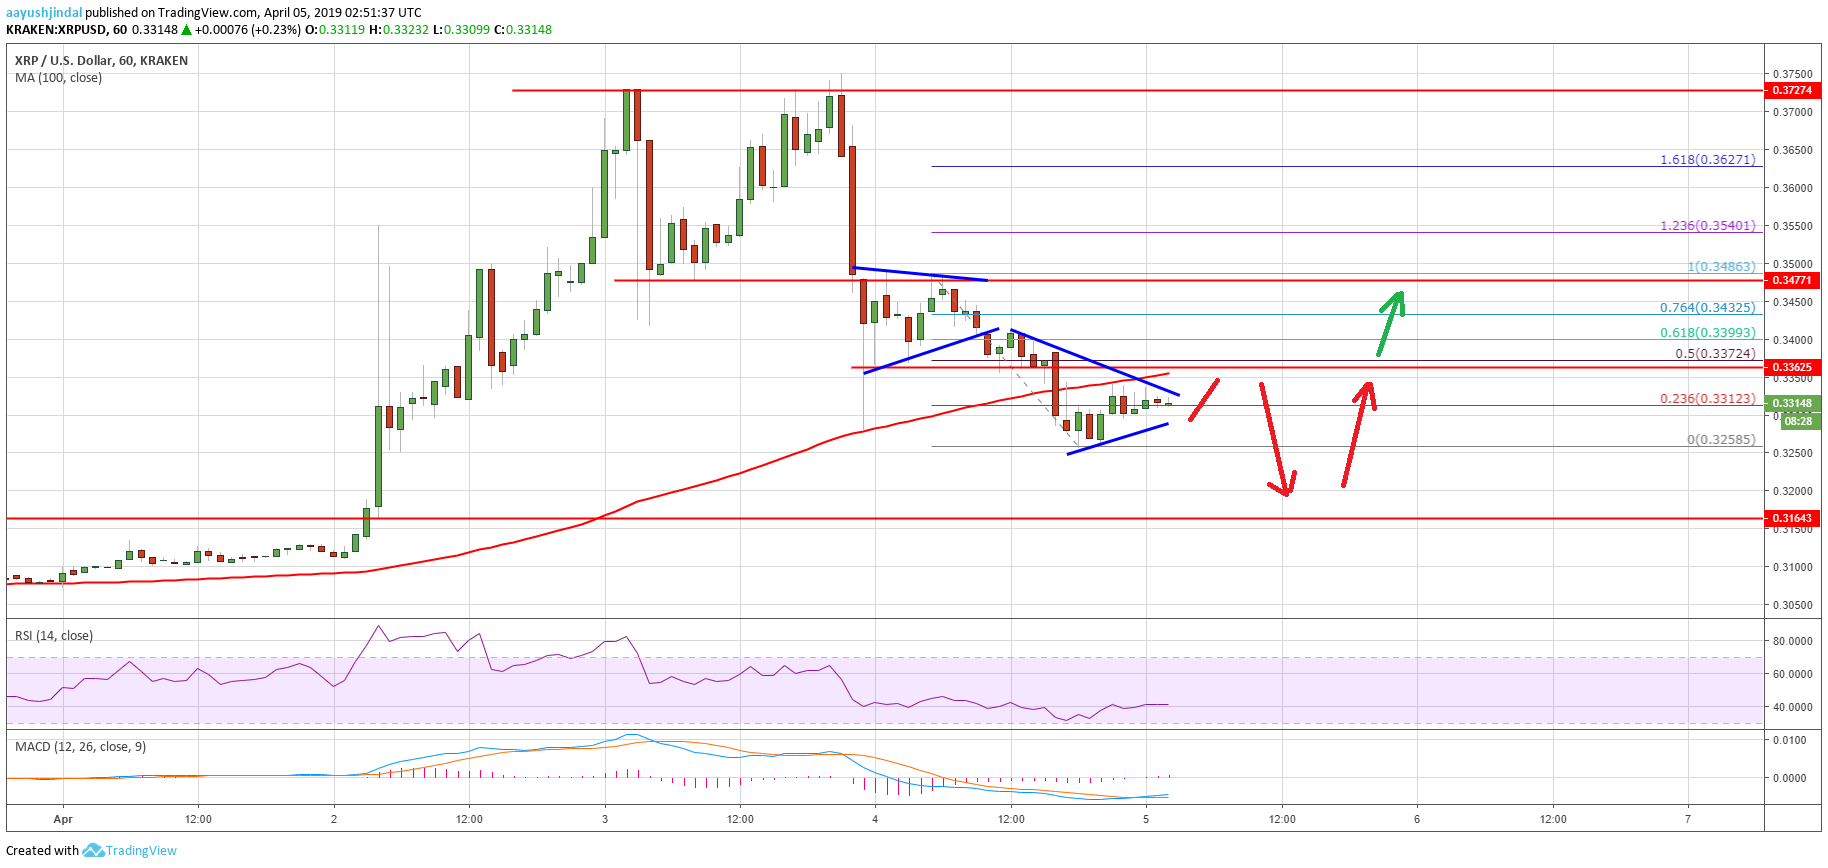
Looking at the chart, ripple price remains at a risk of more losses below the $0.3260 and $0.3250 levels. It could even revisit the $0.3200 support area, where buyers are likely to emerge. To the upside, a successful close above the $0.3400 level may improve the market sentiment. Finally, a close above the $0.3480 and $0.3500 resistance levels is must for buyers to resume XRP’s uptrend.
Technical Indicators
Hourly MACD – The MACD for XRP/USD is slowly moving in the bullish zone.
Hourly RSI (Relative Strength Index) – The RSI for XRP/USD is currently moving higher from 30 and it could test 45.
Major Support Levels – $0.3260, $0.3250 and $0.3200.
Major Resistance Levels – $0.3370, $0.3380 and $0.3400.